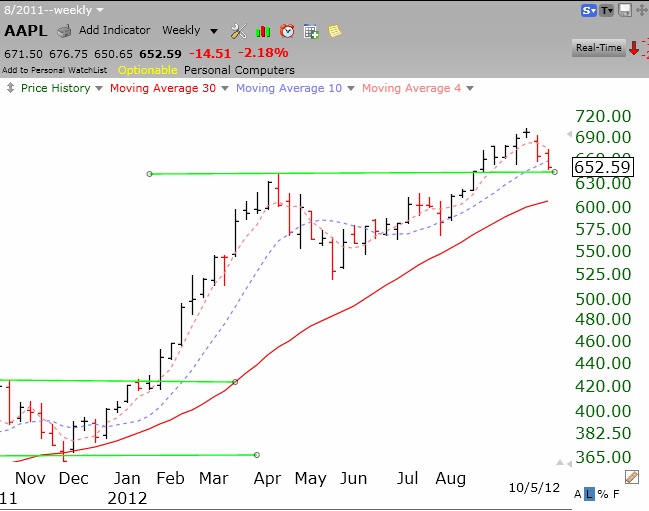
The short term QQQ up-trend reached day 2 (U-2) on Friday but could turn down with a weak day on Monday. The QQQ reflects tech stocks and is heavily influenced by AAPL. For the first time since last June, AAPL has closed below its critical 10 week average (blue dotted line in chart below). I have found it profitable only to hold AAPL when it is above its 10 week average. I do not know if this weakness is just the pre-earnings release swoon or something more ominous. I have a small put position in AAPL for the coming week. It will be an especially negative sign for me if AAPL closes below its last green line top, around $644. Click on chart to enlarge. When the leader cannot push to new highs, it often is a sign of future weakness for the rest of the market.
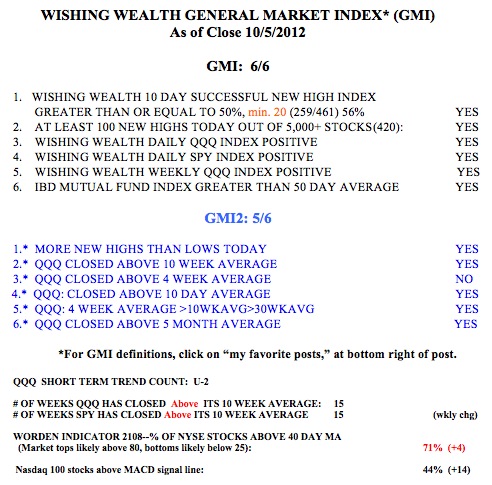
Meanwhile, the GMI remains strong, at 6 out of 6 and the T2108, at 71%, is in neutral territory.