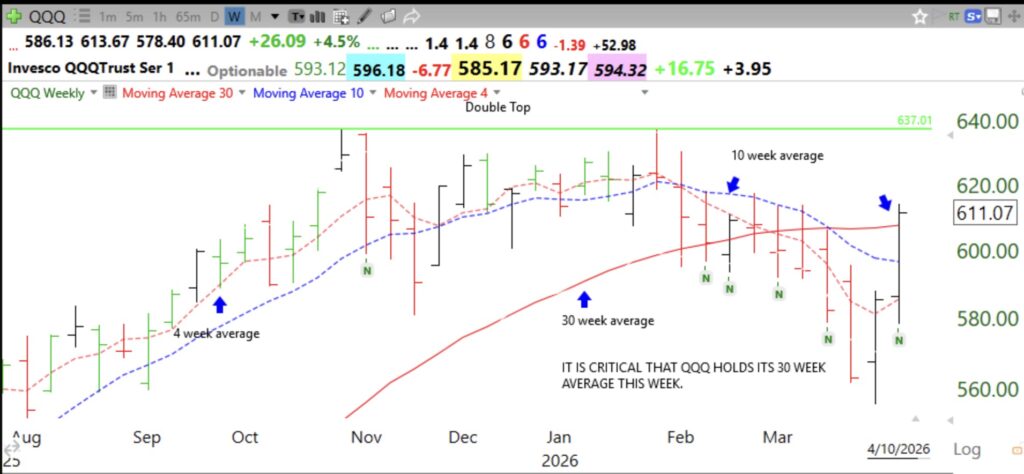
I will discuss the evidence for my GLB (green line breakout) setup during my presentation to MoneyShow 2026 on April 22. Please disseminate this link widely to all who you think will enjoy hearing about my strategies. This link works for emails. This weekly chart of QQQ shows my primary way to gauge its trend. The 4 and 10 week averages are below the 30 week. Many tops have occurred with a rebound to the 30 week only to decline below it. When the 4 and 10 week averages climb back above the 30 week we have a Stage 2 up-trend. Just study this chart. Compare the prior up-trend to the current pattern.
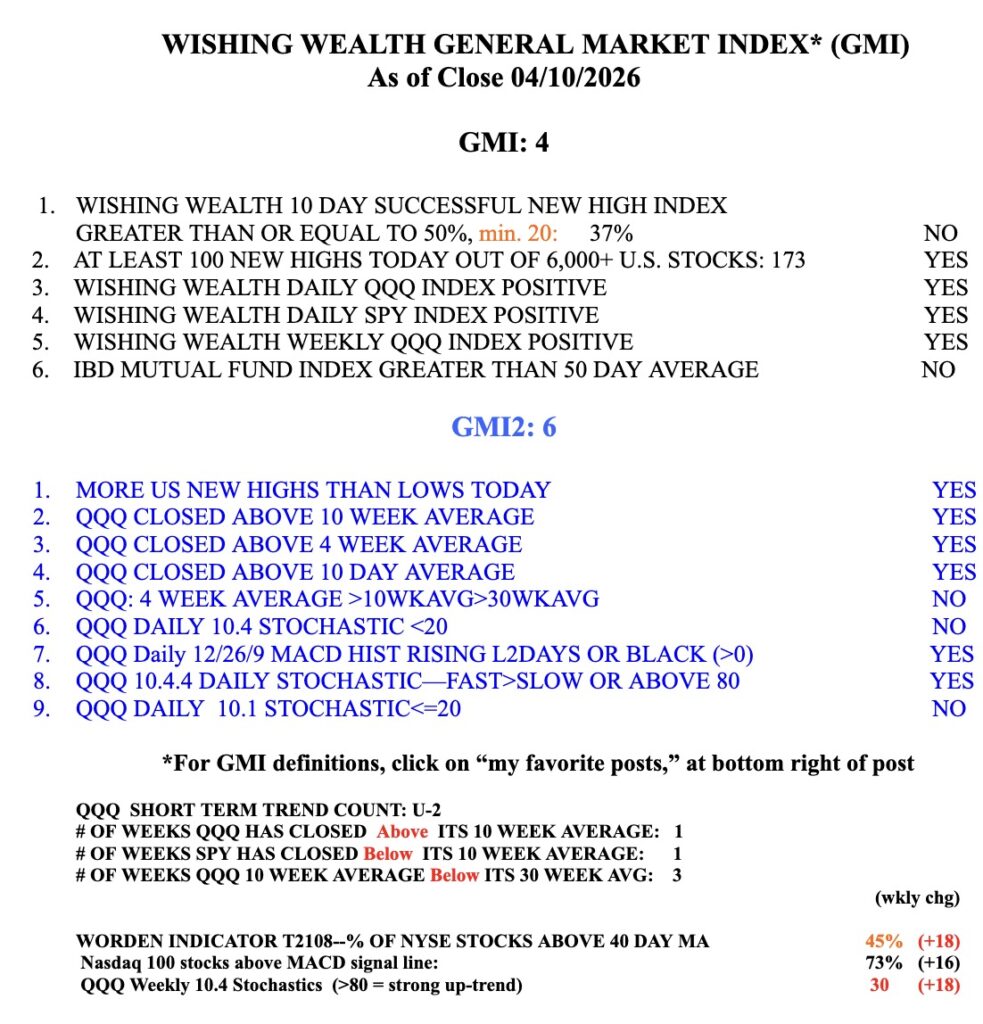
The GMI has now turned GREEN.