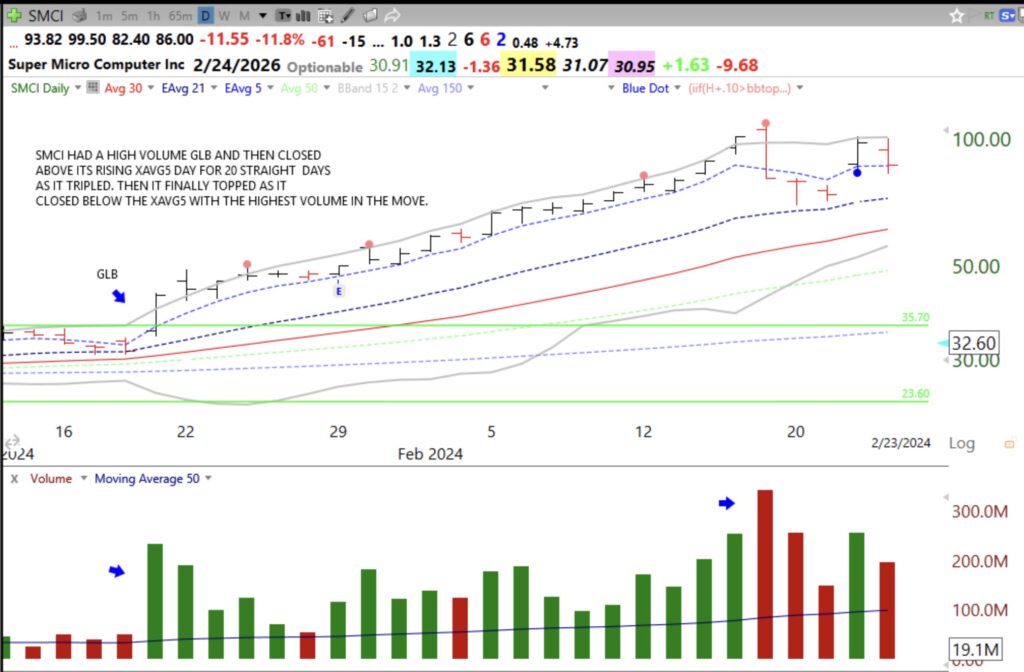
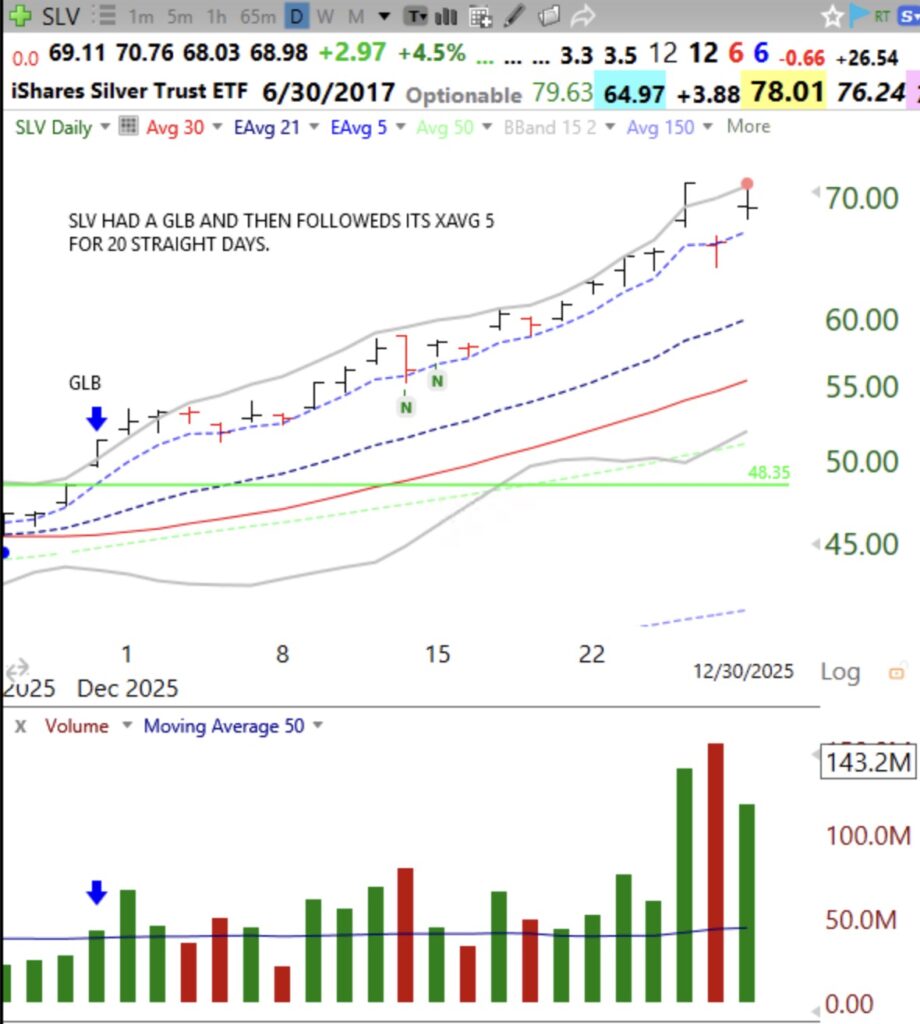
I have found that the 5 day exponential moving average, XAVG 5, is an excellent indicator of a climbing rocket. I I scan for stocks with a a recent GLB (green line break-out at an ATH) that are riding their XAVG 5 (purple dotted line) higher. Study these examples of SMCI and SLV and then examine how your other strong stocks have behaved with respect to this indicator. Question to ponder: Why do some stocks track a moving average so closely for long periods? Are there so many persons trading off of the same average?
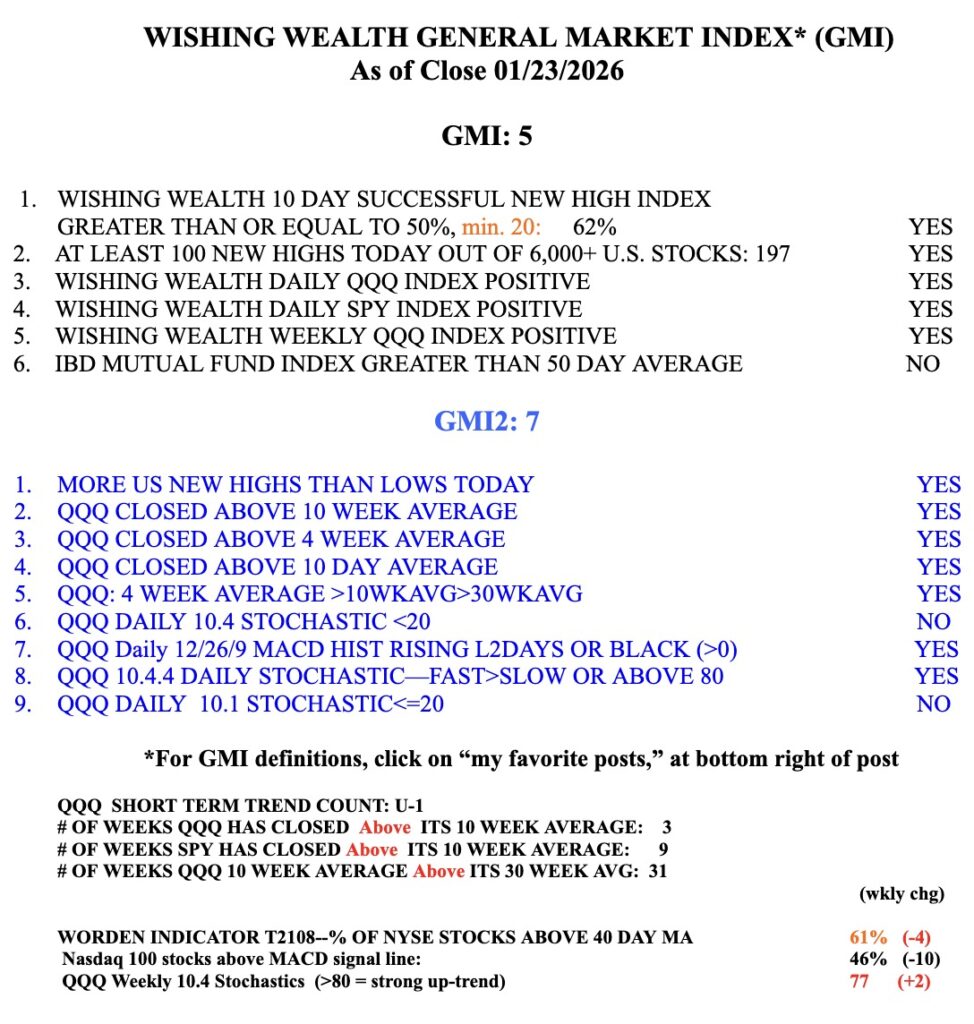
The GMI is still GREEN.
Thank You Dr. Wish. I look forward to your posts as I know many do!!
All very well. But what are your selling rules when the rocket loses steam? After all, prices may wobble above and below your 5EMA, yet remain very strong. With TC2000, do you subject your stock’s industry chart to similar 5EMA analysis?