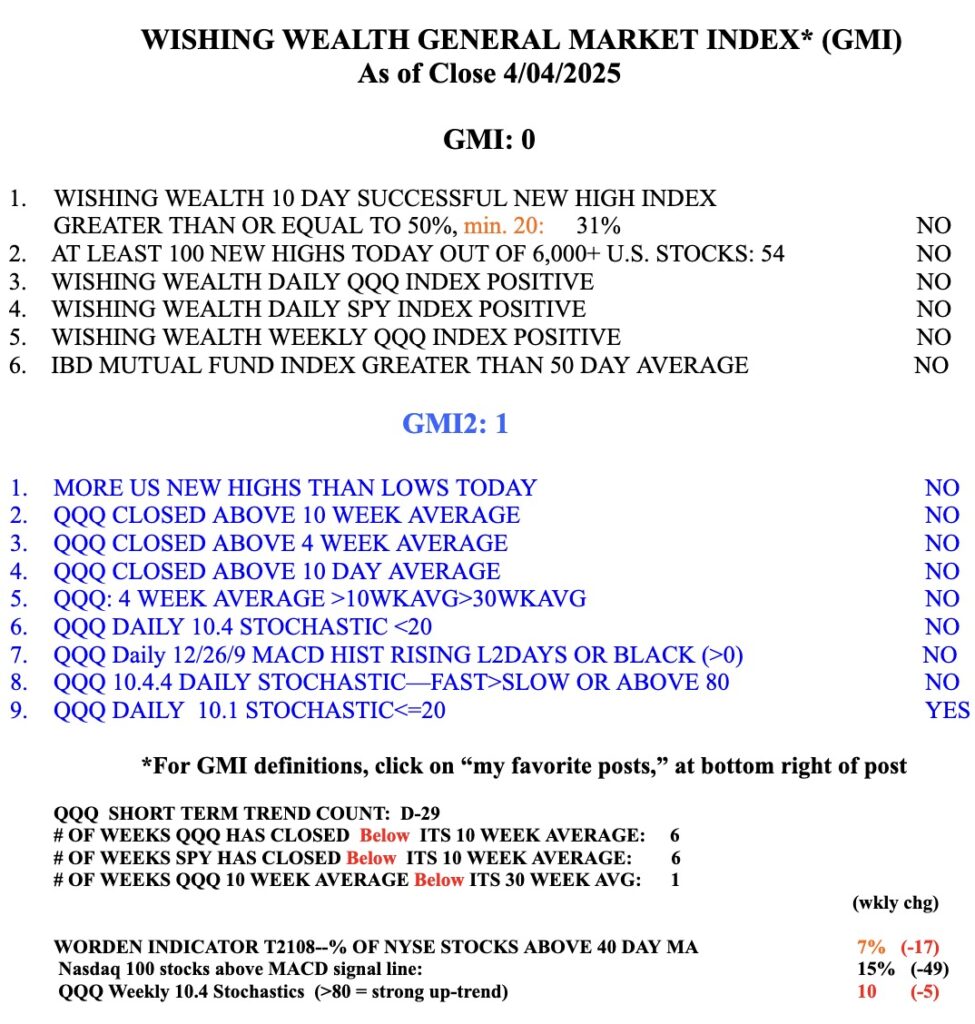
The 10 week average of QQQ is now declining below its 30 week average, for the first time since February, 2023. That usually happens at the beginning of a major decline. And yet T2108 is at at 7%, an extremely oversold level where prior bottoms tended to occur. I am just about all in cash and will not jump in long at the first rally. If I had bought and held the 3x leveraged inverse ETF, SQQQ, that tracks QQQ on Day 1, it is now up +65%. QQQ is down -18%. I nibbled at some SQQQ and TWM much later and have nice gains.
I am amused at the media pundits saying that the current 2 day 10% decline is a historic crash when I remember the one day drop of 20% in Oct, 1987 and the huge decline in 1974.
No one knows how and when this decline will end. I am extremely sad for my fellow Boomers who have seen their retirement and life savings take a big hit. They are one reason I post this blog. Youth can wait decades, if necessary, to recoup their losses. The rest of us may not have enough time.
As for the experts who claim it is impossible to time the market, I say look at my posts going back to 2006. I avoided the declines in 2000, 2008, 2020, 2022 and it was really not difficult. Just review how I use Stage Analysis, my GMI, Guppy charts and 10:30 weekly charts. I show my class slides of the indexes going back to 1929 that demonstrate how to apply stage analysis. I also publish here what I am doing.
I am content to sit on the sidelines now and wait for evidence of a new up-trend. It is far easier to profit on the long side when the GMI = 5 or 6 and is flashing GREEN.
Thanks for the update and your teaching. I look forward to your posts. Was wondering if you would nibble at SPY with T2108 below 10. QQQ completes A-B-C pattern at$420. Looks like it will over shoot. I am also chicken. All cash. I’m also a boomer.
So fortunate I was able to convince my boomer parents to liquidate their life savings. Truly grateful for Dr. Wish.