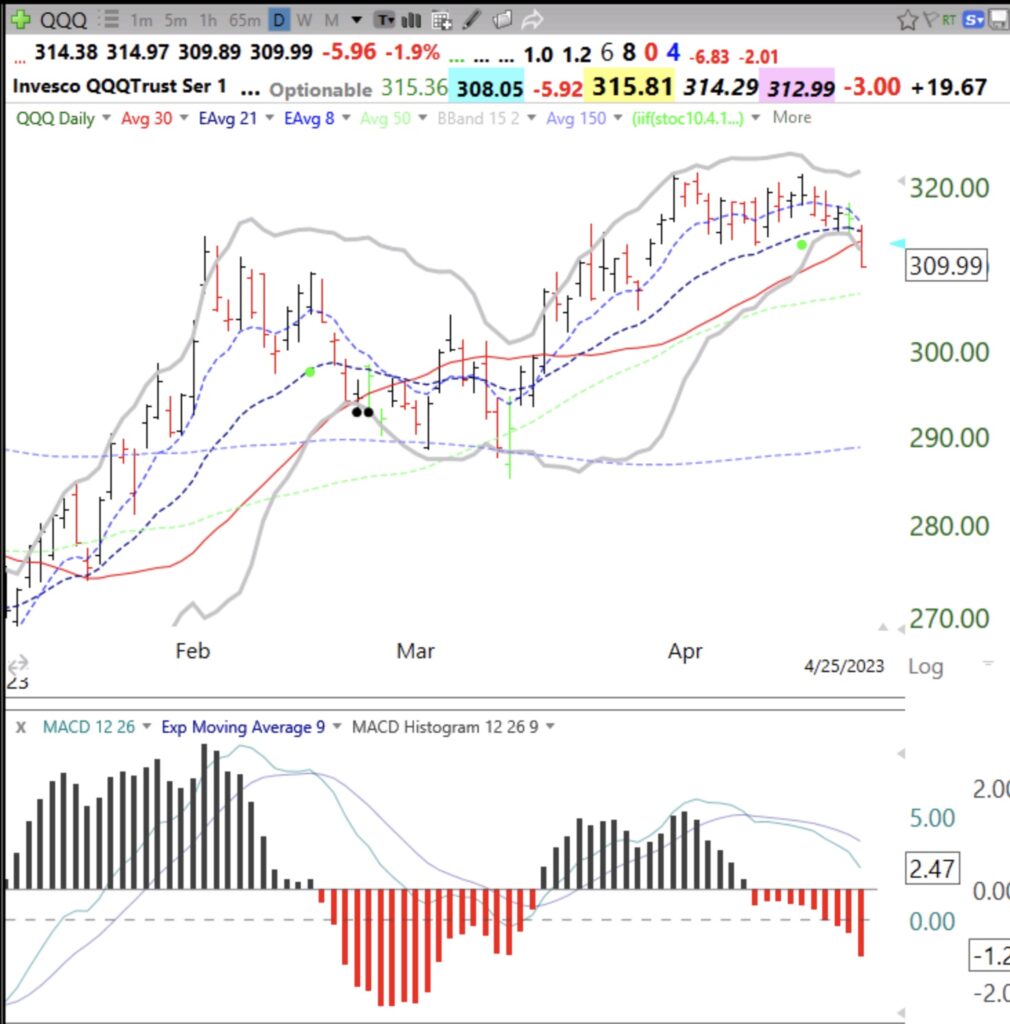
I wrote a few days ago that the MACD histograms were weakening, making me think that QQQ might break below its lower constricting BBs. Note in the daily chart below that the MACD histograms have been declining and red for the past 10 days. A rising security will generally have a rising pattern of histograms and eventually they should turn black (positive values). Until today, QQQ has not closed below its bottom BB since last December. We could have a large move. The index futures are currently pointing to a rise at the opening on Wednesday. It will be very revealing to see if QQQ can close back above its lower BB. Time for me to be short or out. I like SQQQ if QQQ fails to hold and we begin a QQQ short term down trend by Wednesday’s close. Sell in May time is approaching as is the debt fight, see discussion below.
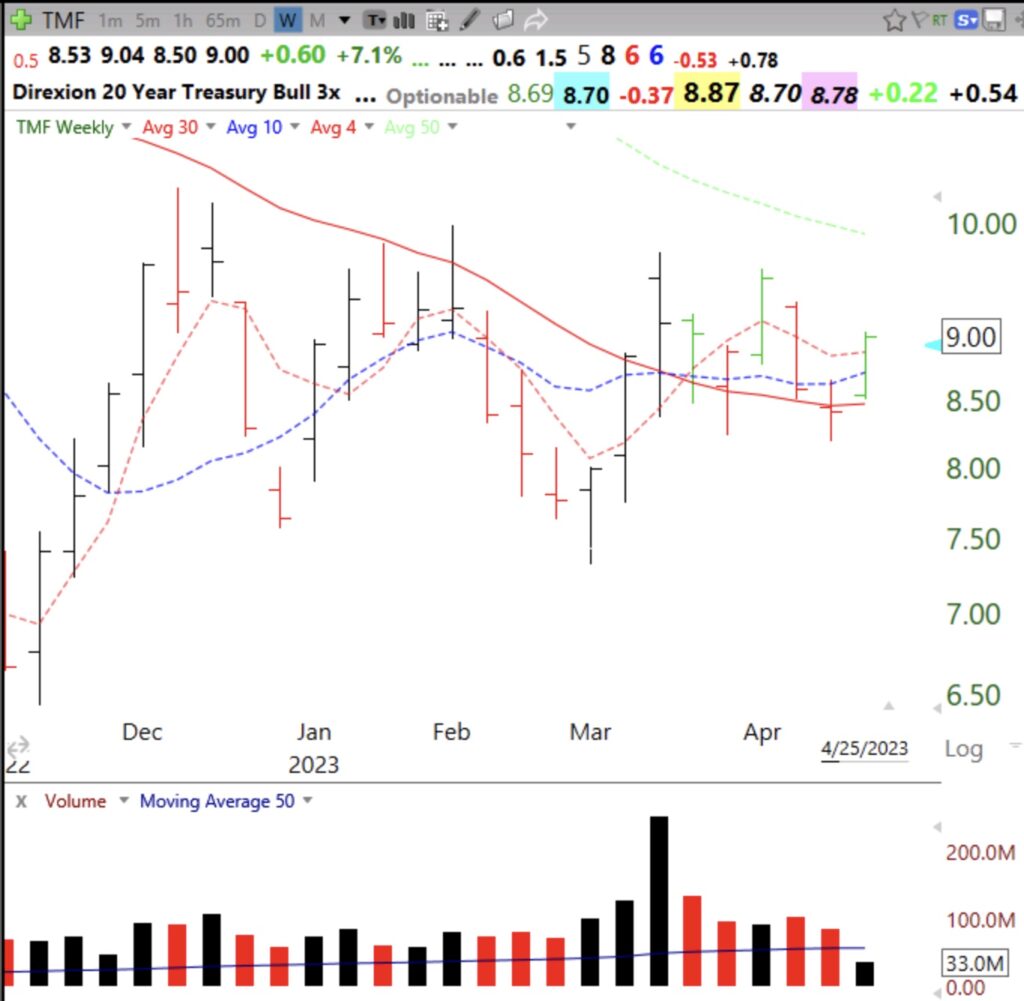
I wrote a few days ago that gold and treasuries rose during the debt crisis in 2011. TMF is rising already. This weekly chart shows TMF has climbed above its 30 week average, which is beginning to turn up. Note the huge volume 6 weeks ago. Stage 2 up-trend coming? If the debt fight takes off, I will accumulate TMF. People hide in long term treasuries and gold when they become scared. But beware–gold and treasuries will decline quickly once the storm has passed.

