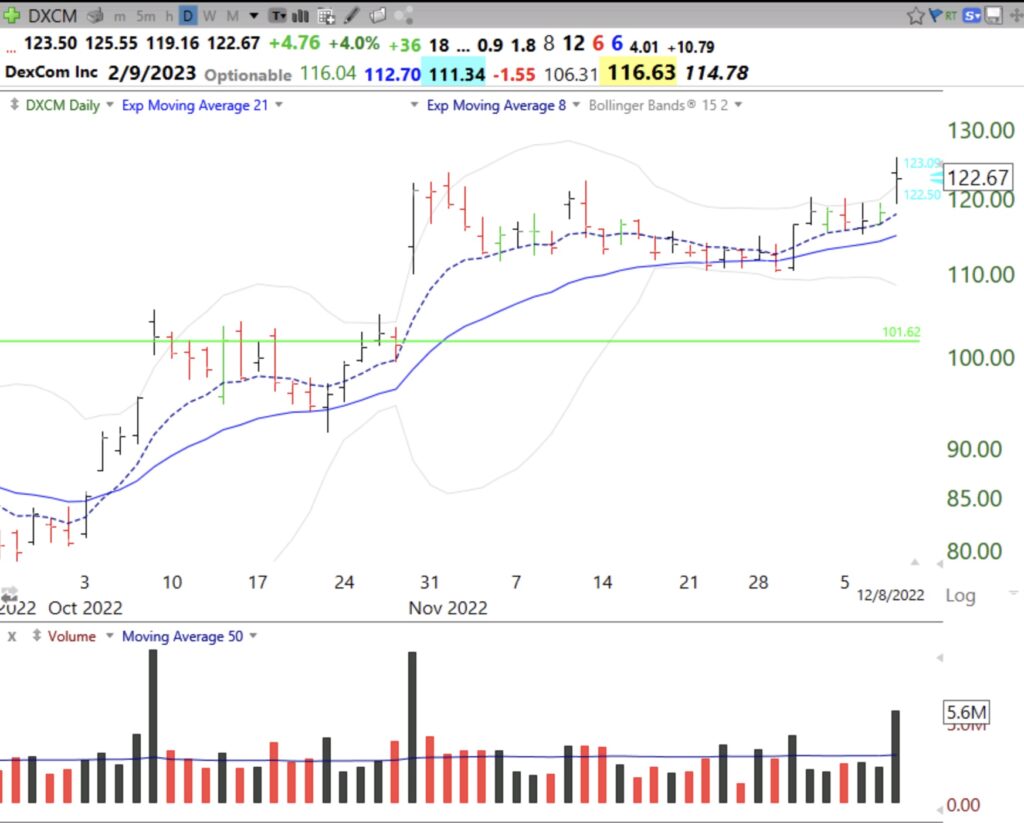
Note strong volume Thursday and likely VCP. Green line top is at $164.86
Share this:
- Click to email a link to a friend (Opens in new window) Email
- Click to share on Facebook (Opens in new window) Facebook
- Click to share on X (Opens in new window) X
- Click to share on LinkedIn (Opens in new window) LinkedIn
- Click to print (Opens in new window) Print
- More
- Click to share on Pocket (Opens in new window) Pocket
- Click to share on Pinterest (Opens in new window) Pinterest
- Click to share on Tumblr (Opens in new window) Tumblr
- Click to share on Reddit (Opens in new window) Reddit
- Click to share on Telegram (Opens in new window) Telegram
- Click to share on WhatsApp (Opens in new window) WhatsApp

Hi Dr. Wish:
Looking at the monthly chart for DXCM, I can’t see why 101.62 is a green line? It looks like there would have been a green line at 114.06 in Aug 2020 and 164.86 in Nov 2021.
Also, what does green line “top” of 164.86 mean? Is that where you would sell if you bought it now?
Thanks.
Thank you. I corrected my post. DXCM is not near its green line top. I would only buy it if it breaks through its historical peak of $164.86.