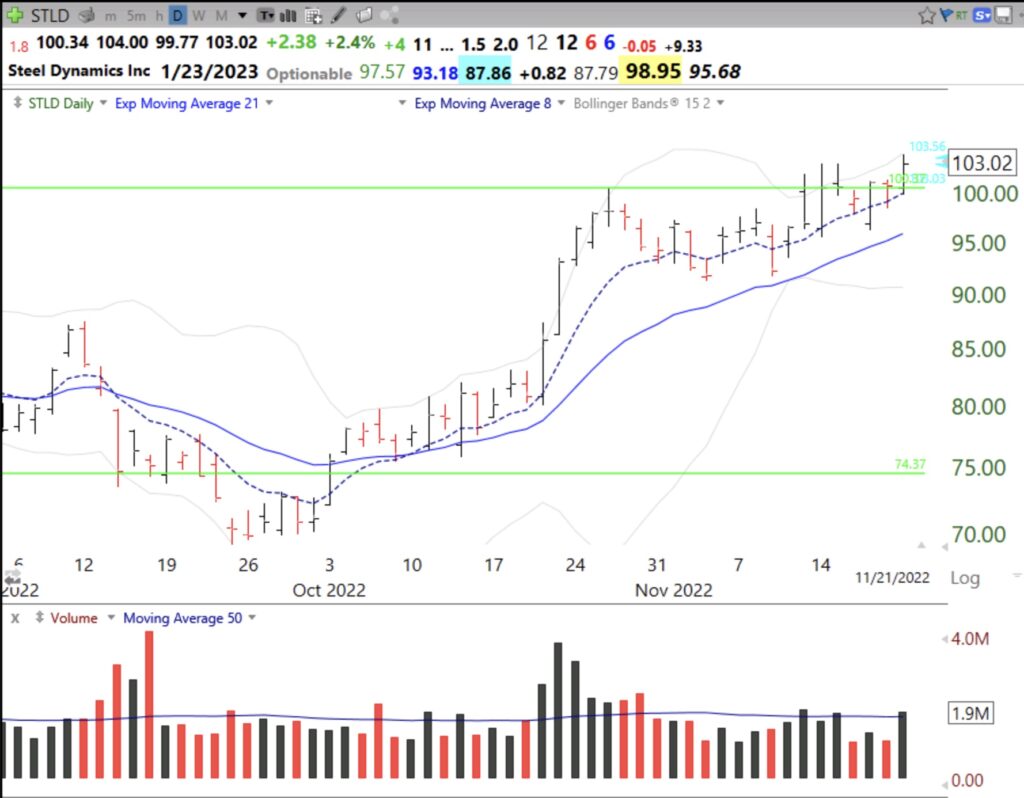
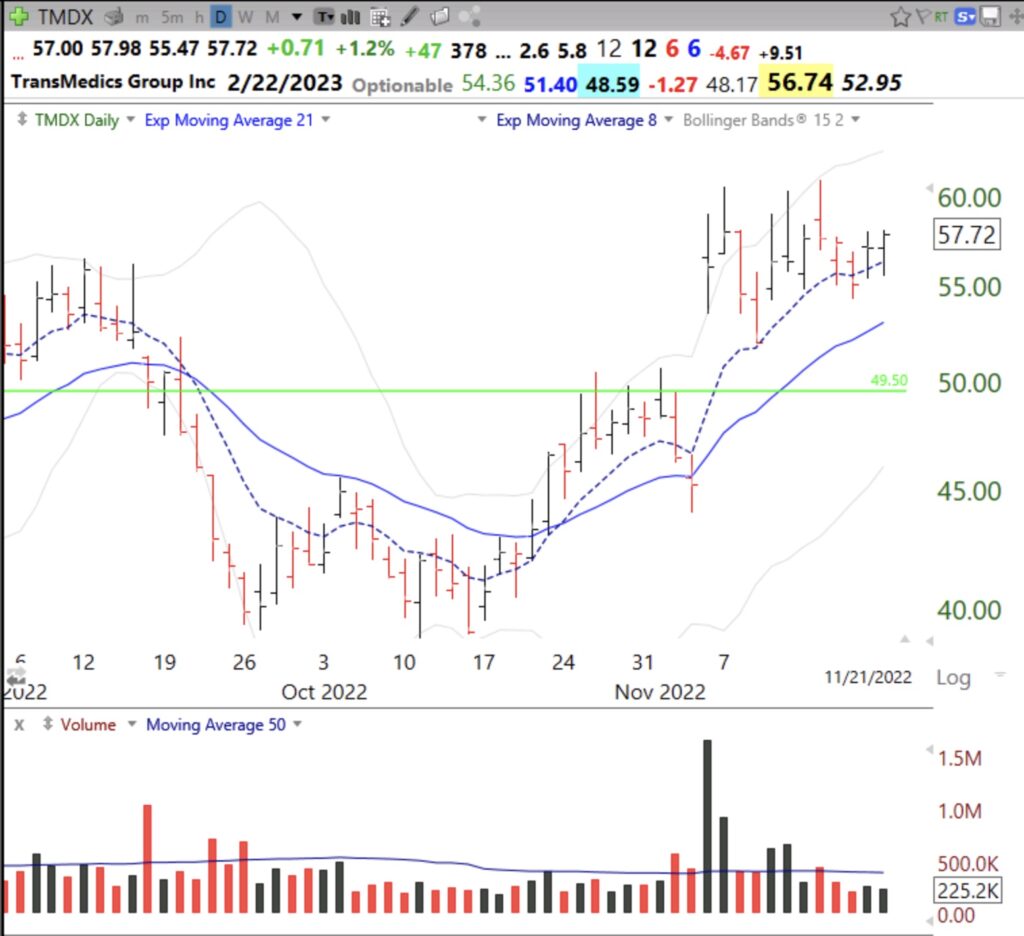
$STLD has been holding up well after its GLB (green line break-out) last week. Note how it is tracking its 8 exponential moving average (dotted line). Note the bounce up off of that average on Monday. If I bought it, I would place my stop below Monday’s low or sell if it closes below the green line. $STLD came up in my TC2000 scan of my IBD/MS watchlist for stocks that are near an ATH, have a rising 8 EMA above the 21 EMA for at least 7 consecutive days, and bounced up off of the 8 EMA. Another stock that came up was $TMDX. Others were: PSN, RJF, VMI, GPC, FICO and AIT. Check them out.

