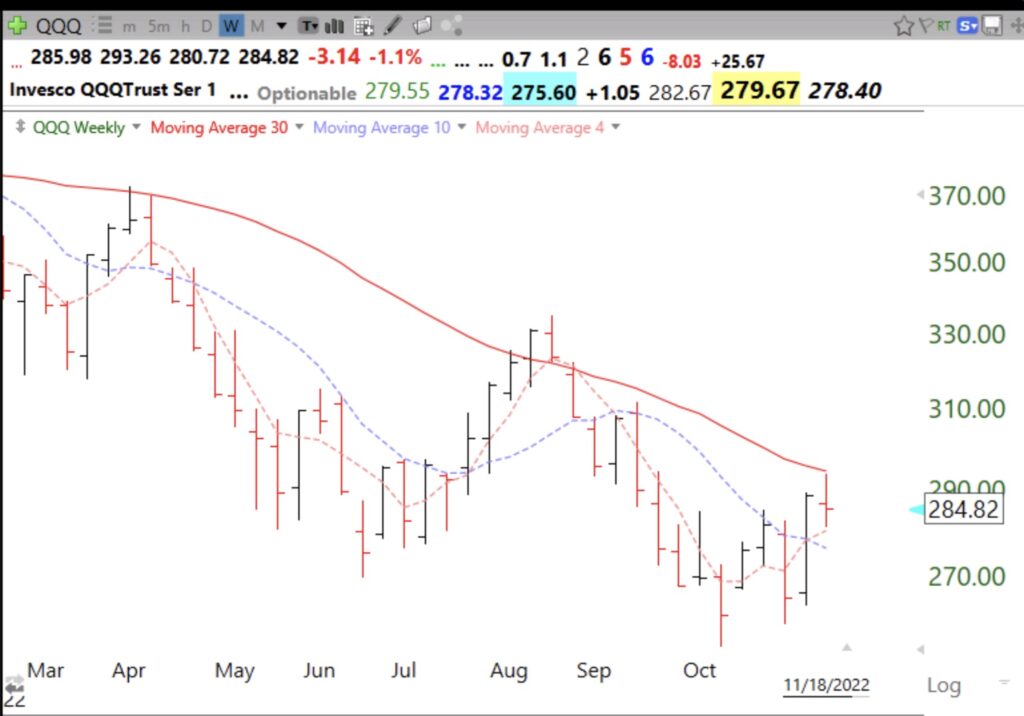
The 4 wk avg is the pink dotted line and the 30 wk avg is the red solid line. Note that last week QQQ was sandwiched in between these two averages. The rising 4 wk avg above the 10 wk avg (purple dotted line) is a positive sign. A close this week above the 30 week could be a further sign of strength, although such a pattern failed to hold last August. On the other hand, a close below the 4 wk would suggest further weakness to come. Stay tuned…..
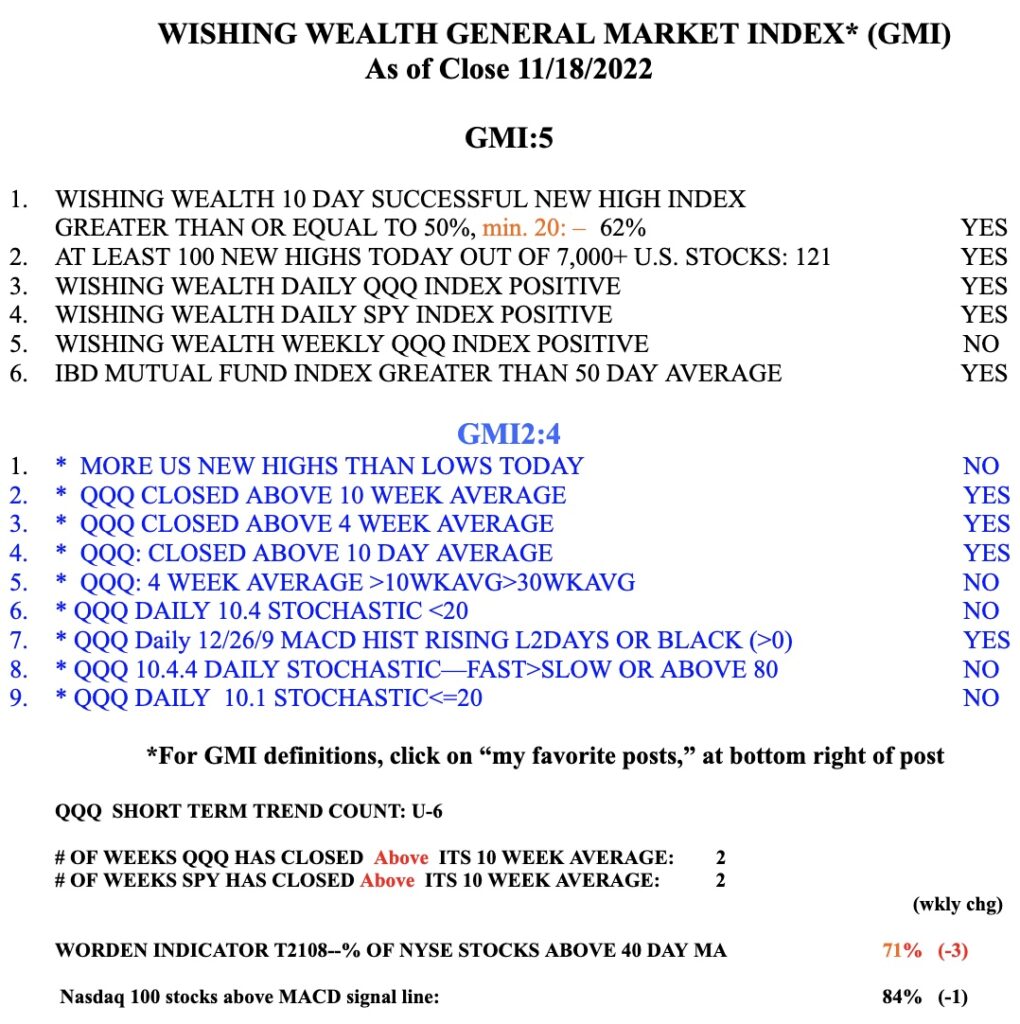
The GMI registers 5, of 6, and remains on a Green signal.


I hope you are completely Covid free and enjoying your holiday! Does the GMI 1 turn positive with three YES answers? What is the annualized return of buying when the GMI turns green and selling when the GMI turns red?
GMI turns Green with 2 consecutive closing days >3 and Red with 2 consecutive closes below 3. Have only charts which I have posted but no stats.