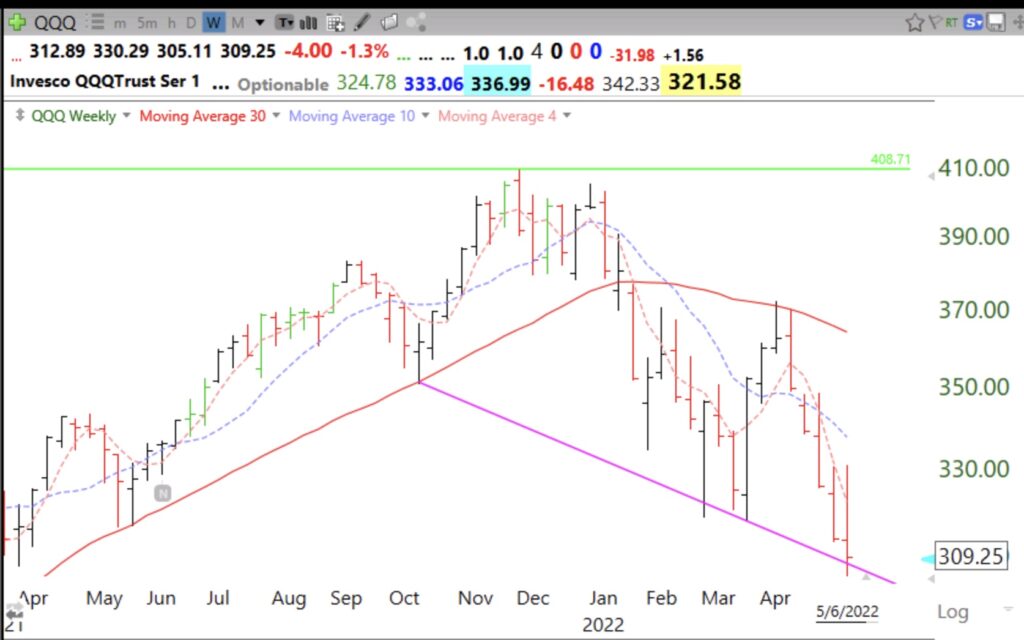
QQQ has approached the trend channel line (TCL) I drew weeks ago and may bounce. If you want to learn about trend channel lines you can look up the work of Al Brooks or attend the monthly Northern Virginia IBD meetups where Vas teaches this type of technical analysis. Vas presents a great lecture to my students every year. I am impressed by how the lines he draws anticipate turning points. I hope he agrees with where I drew this TCL. You can also follow his tweets: @TCLTrader
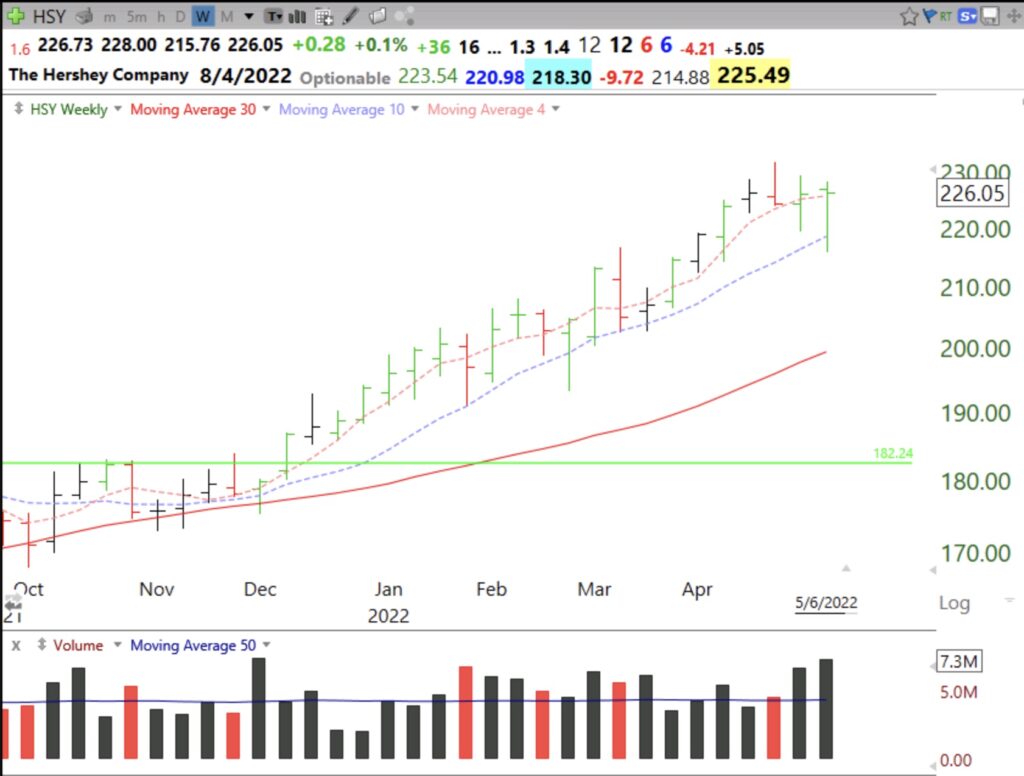
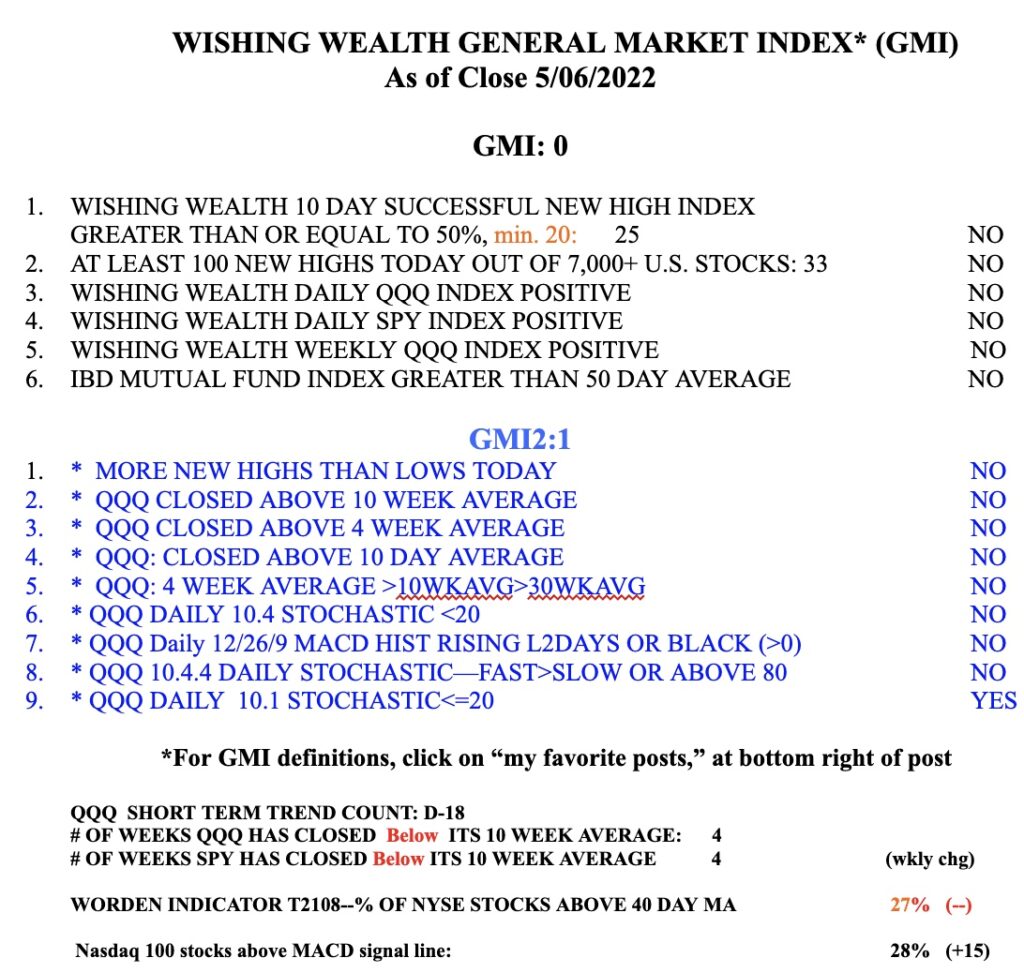
I guess human beings will not give up their chocolate. That is one conclusion I draw from Hershey’s (HSY) strong action this year. HSY had a GLB (green line break-out) to an ATH last December at 182.24. It closed last week at 226.05 (+22% since the GLB) and now has a weekly green bar signal. Last week it bounced its 10 week average and retook its rising 4 week average. An advancing stock has the pattern 4wk>10wk>30 wk, see my chart below. If I were to buy HSY this Monday I would place an initial stop loss order just below last week’s low of 215.76. However, the odds may be against any purchase working out during this declining market, with a GMI = 0, see table. To learn more about my indicators and strategy you may view my webinars by going to my blog menu and selecting them. Also follow my tweets: @WishingWealth.
I hope many of my readers exited the market last November when I told you I did. No one knows when this decline will end. Based on 50+ years of trading I suggest this decline is still just beginning. Panic has not yet set in. Too many people are looking to buy and the Fed has taken away the punch bowl. If my indicators change, so will I.


