With people being blown up and losing their homes and family and pets, it seems difficult and insensitive for me to focus on making money…..
The market will turn when the news is very bad and we least expect it.The fact that there are more bearish than bullish newsletters, a very rare event, suggests that at least a bounce may be coming. But T2108, at 37%, is far above the level where bottoms occur. And the p/c ratio, in the .80s, is not extreme. I am content to wait on the sidelines mainly in cash and to watch closely. Growth stocks are underperforming now and few of the fallen leaders will retake their ATHs. We need to stop looking for bargains. The leaders will show up on the new 52 week high list, preferably reaching all-time-highs (ATHs). Stocks at ATHs last week are mainly in agriculture, fertilizer, metals and defense.
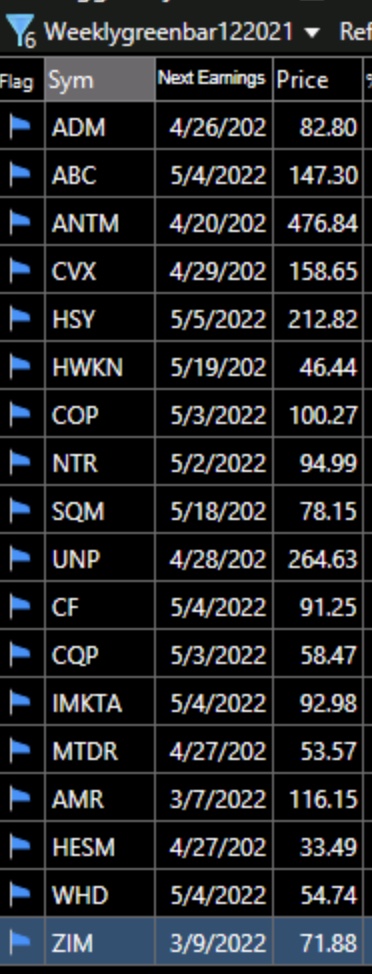
Amazingly, 13 of the 15 stocks that came up in my ATH scan last week actually rose last week during a declining market. One component of my scan requires the stock to have a weekly RS (SPY) at a 20 week high. Here are this week’s 18 candidates: (2 have earnings this week)
Six of them are from the oil and gas sector and five are from agriculture/food. Past performance is not guaranteed to repeat. But I think it is informative to see that some sectors have multiples stocks reaching ATHs. When I ran the same scan on industry indexes the following came up: oil and gas, agriculture, copper and medical distribution.
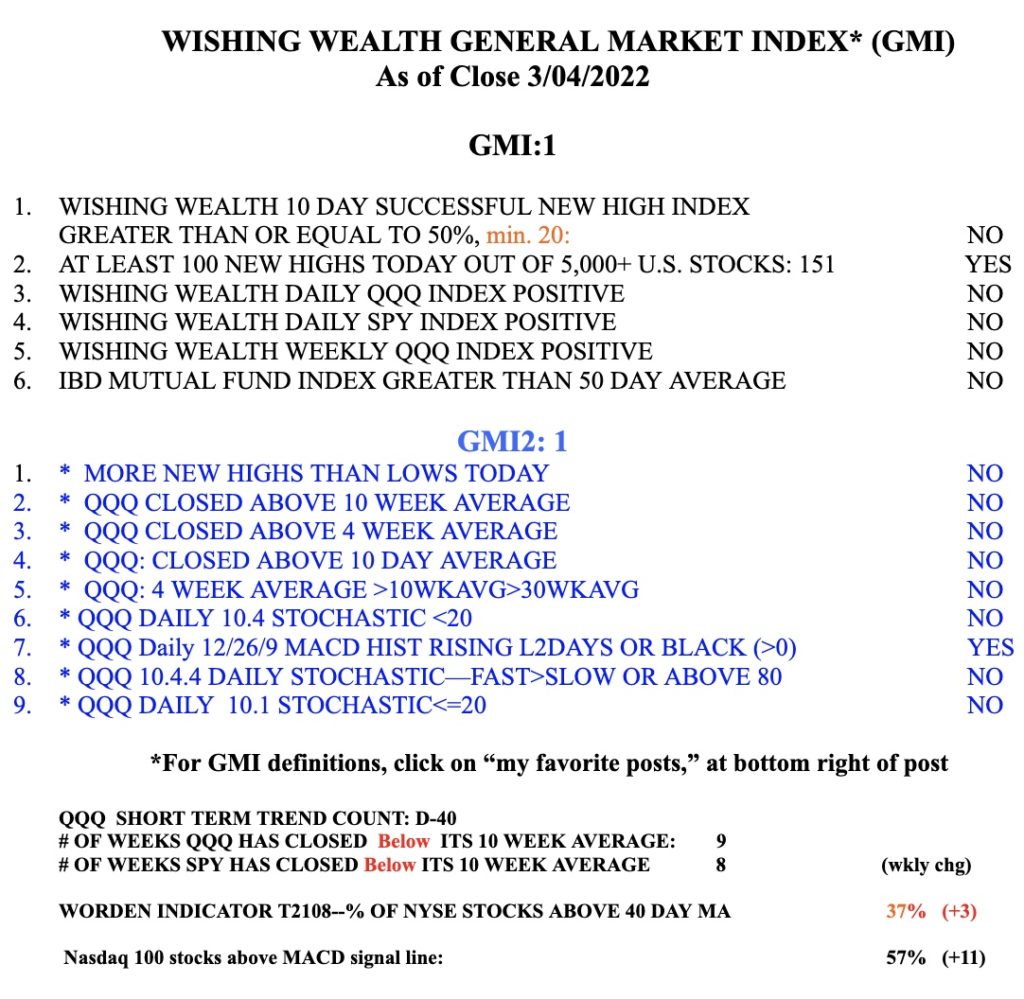
The GMI is 1, of 6, and has been Red since January 10. It is so much easier to profit by buying long when the GMI is on a Green signal. When it is Red, many break-outs will fail.
If I had no inkling of the horrible news, I would say that the charts suggest to me that we are at the BEGINNING of a significant decline. The decline thus far has been slow. In 2000 and 2008 the declines got going after the indexes had entered Stage 4 declines, which they are just doing now……


Dr. wish, How do you scan for a weekly RS (SPY) at a 20 week high in TC2000?
Great vision Sir , thank you for your post and God Bless !
Thank you!
Put RS on your chart and right click on it and go to create conditions and check RS at new high and specify duration.