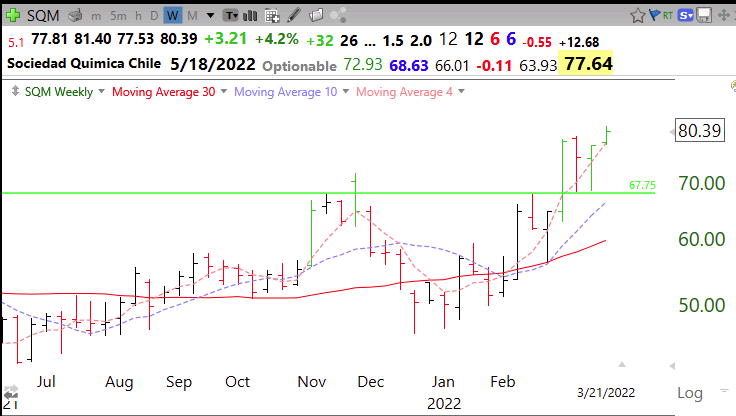
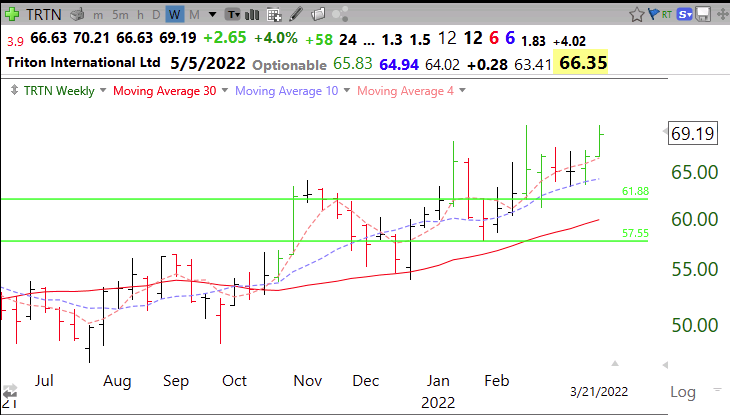
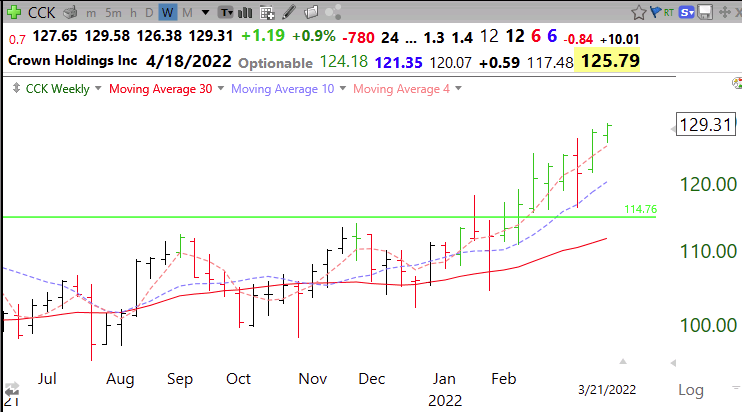
This scan looks for stocks that had a strong weekly chart pattern (4wk>10wk>30wk) +20 week high of relative strength + bounce up off of its 4 wk average (red dotted line). Must also be near an ATH=above last green line top. Note the green price bars. These stocks are worth researching.


