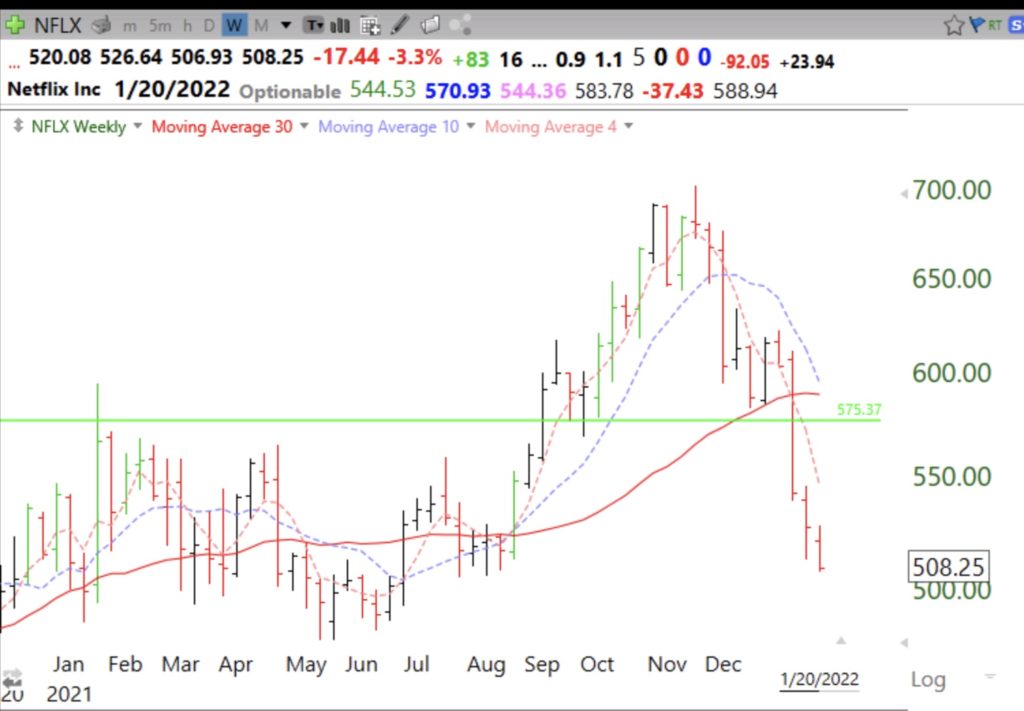
This weekly chart shows that NFLX, which dived tonight after earnings, should have been sold 2 weeks ago when it closed below its 30 week average (red solid line) and below its green line (a failed green line break-out, GLB). These signals help me to avoid major declines. I hold no stock or ETF below its 30 week average or a failed GLB. And now the major indexes are below their 30 week averages……
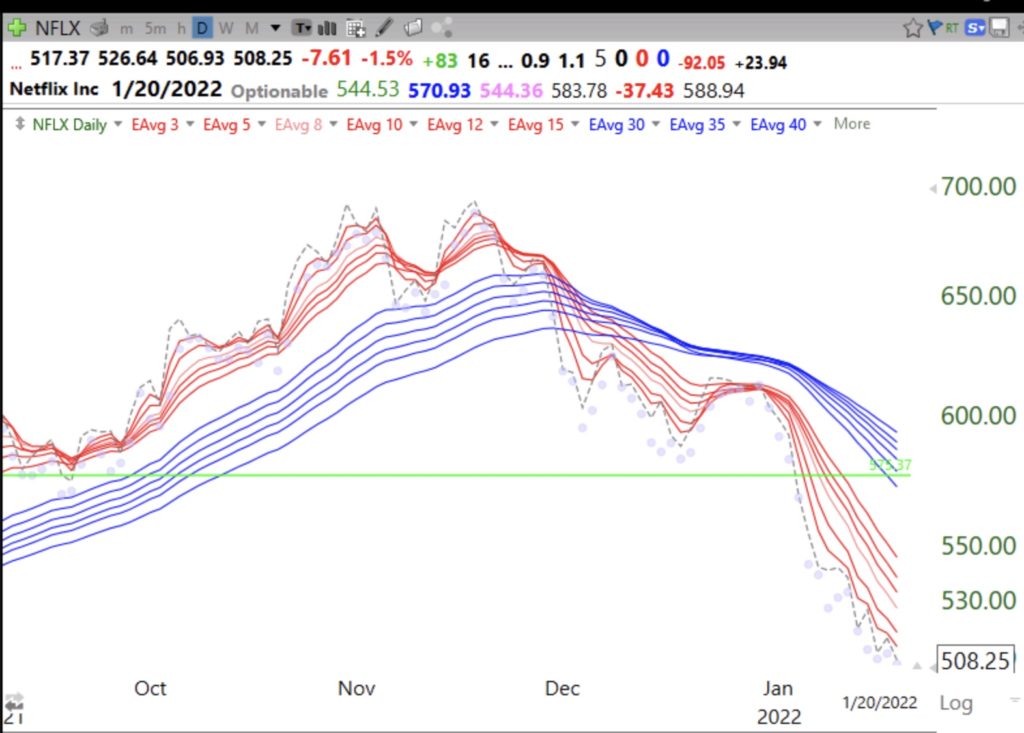
The daily GMMA signaled a break in trend in December when the RWB up-trend ended. (red averages converged with blue).
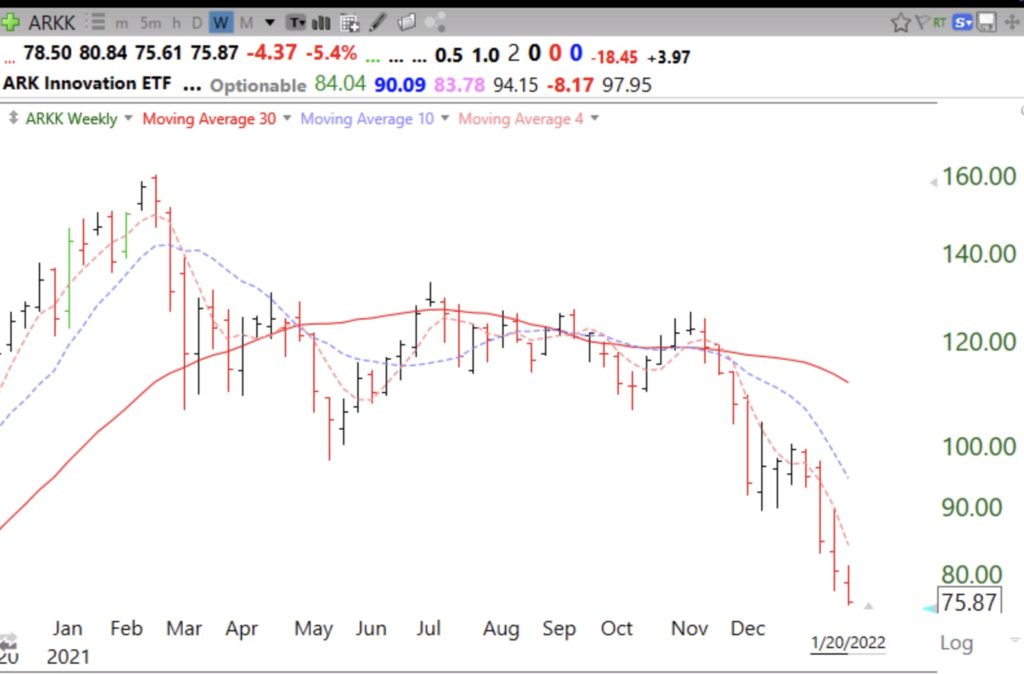
$ARKK has been in a Stage IV decline since Thanksgiving. And in a Stage III top May-October.
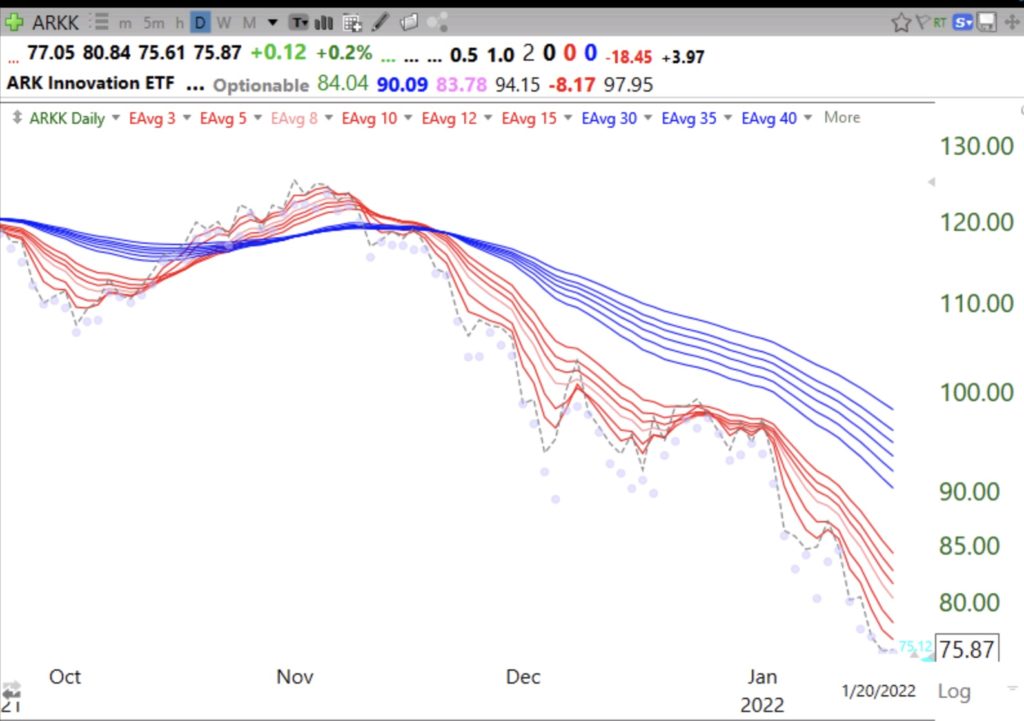
Daily GMMA chart has been in a BWR down-trend since Thanksgiving.
I will describe these indicators during my Eastern Michigan AAII presentation this Tuesday. Register for this free webinar here.


