By the way, if you search Dr Wish on youtube you can find my TraderLion workshop presentation and a tutorial on putting my green and black dot signals on TC2000 charts. Look for Rising Stochastic Indicators tutorial just completed by my co-instructor.
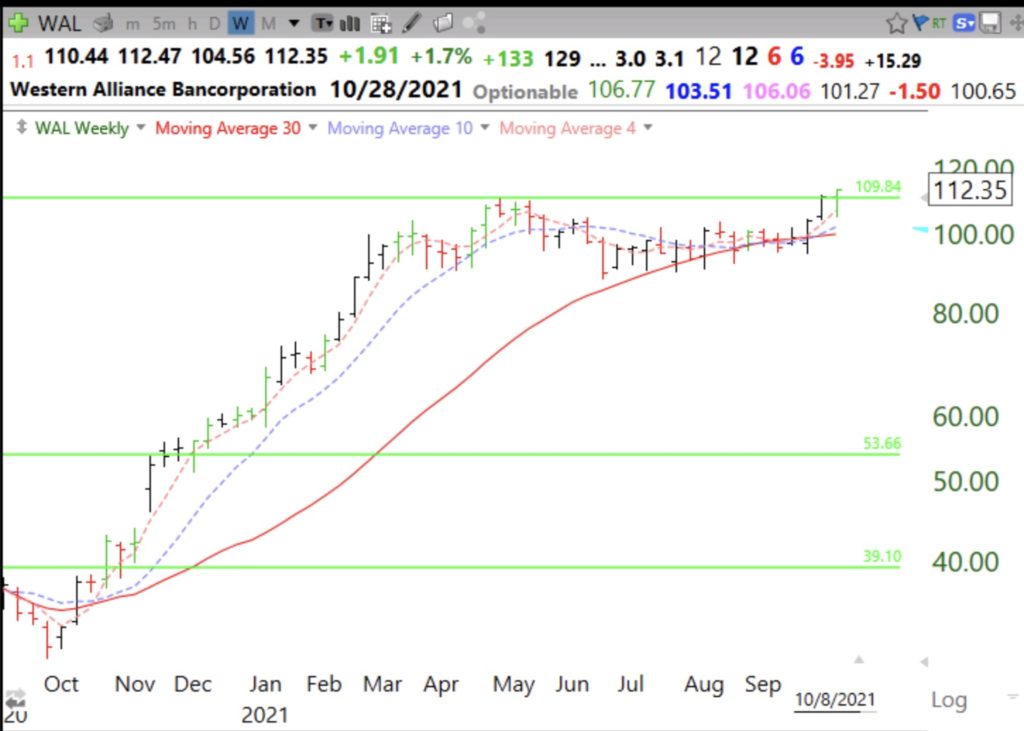
Weekly charts show stock patterns most clearly. WAL has had a nice cup and small handle break-out.
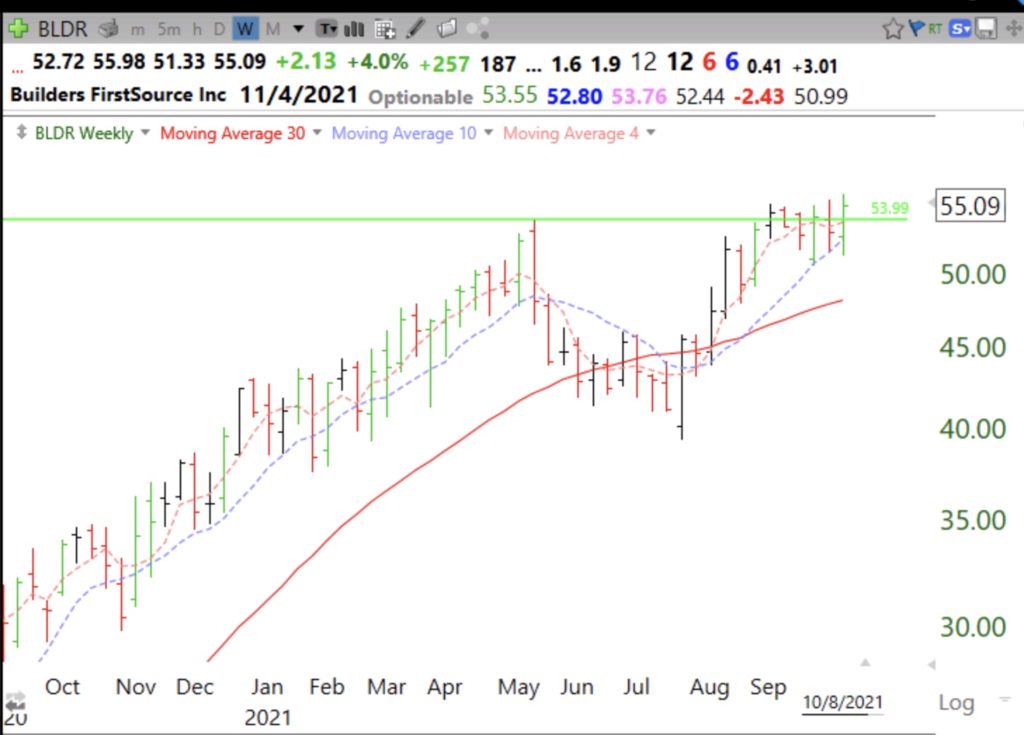
As BLDR.
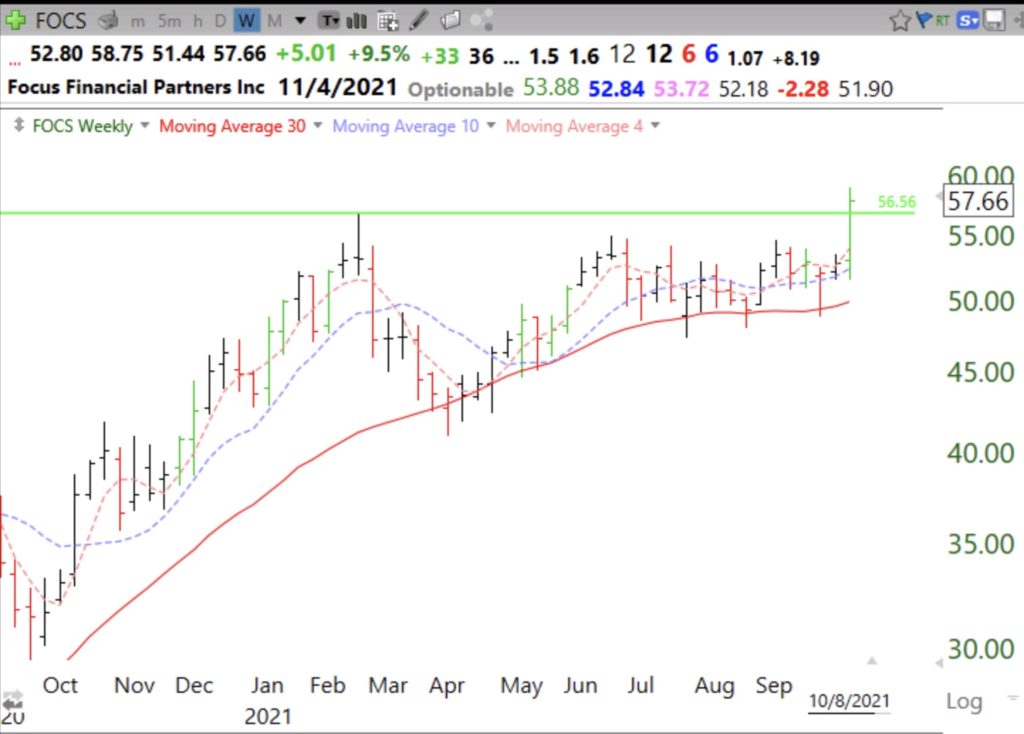
And FOCS
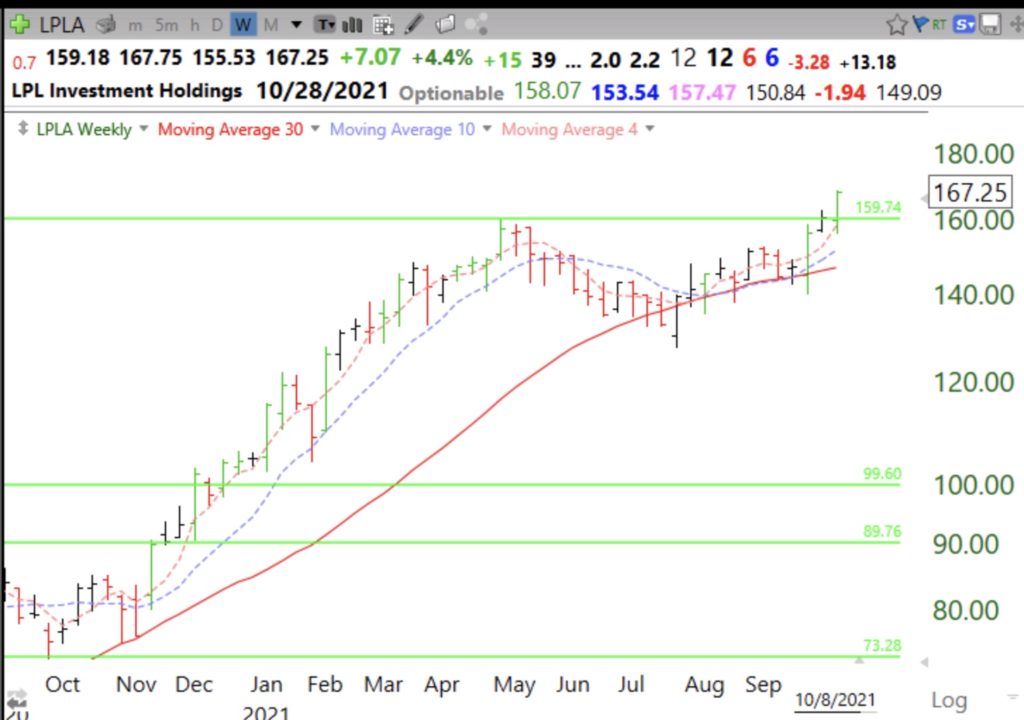
And LPLA
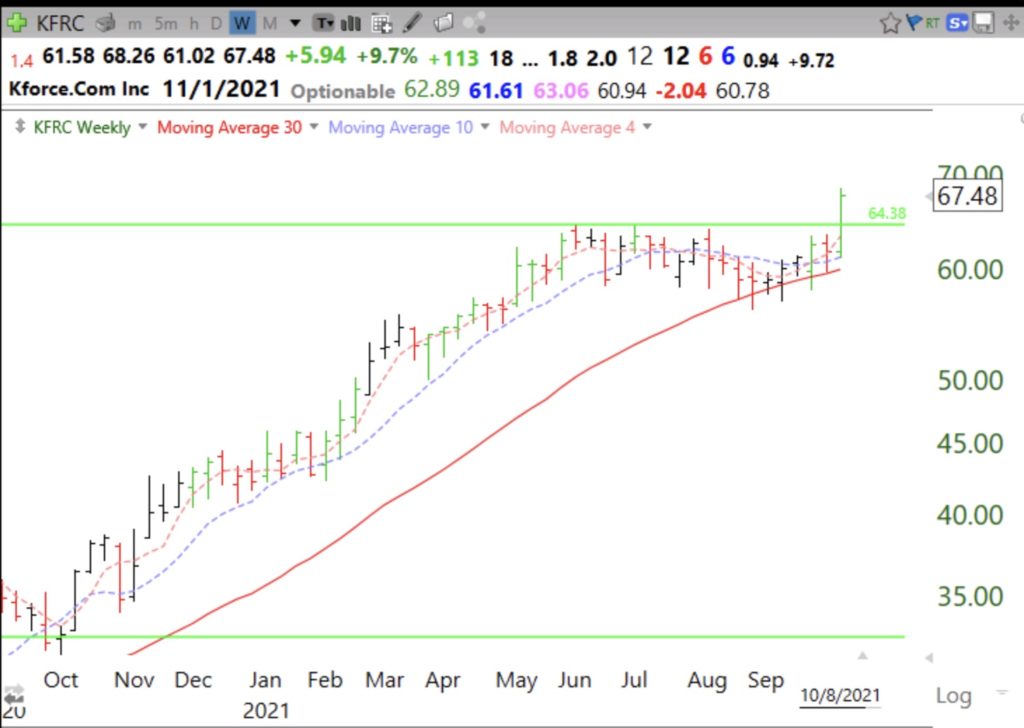
And KFRC
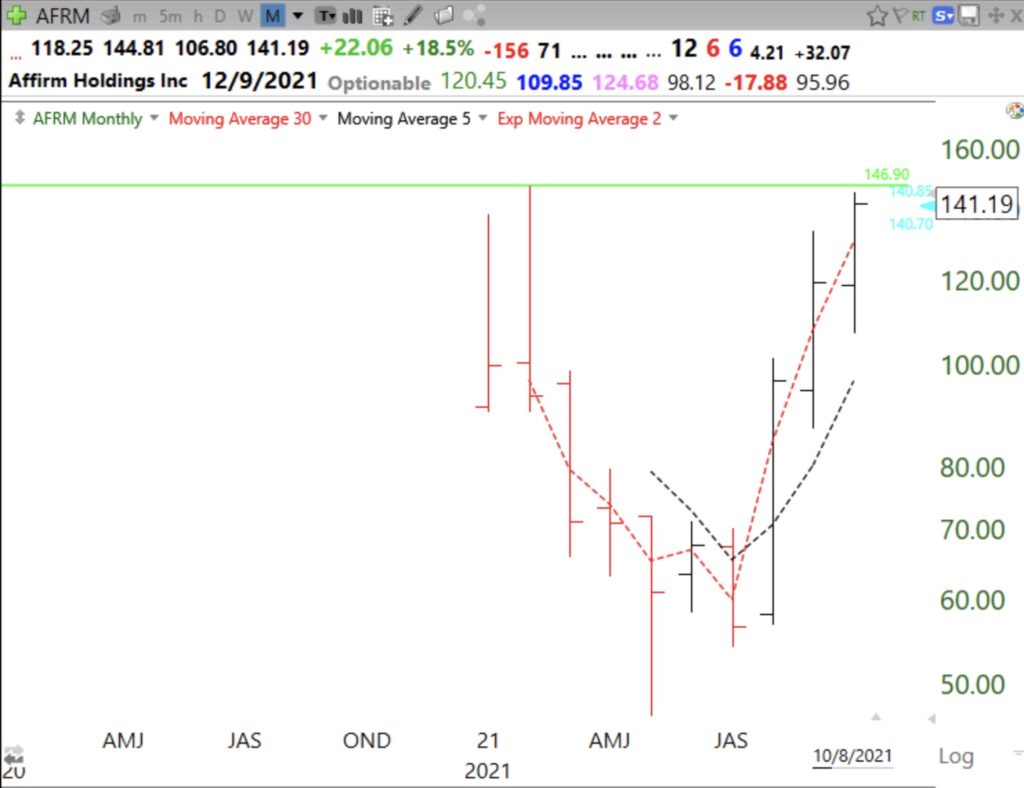
I am also watching UPST for a possible GLB. See monthly chart.
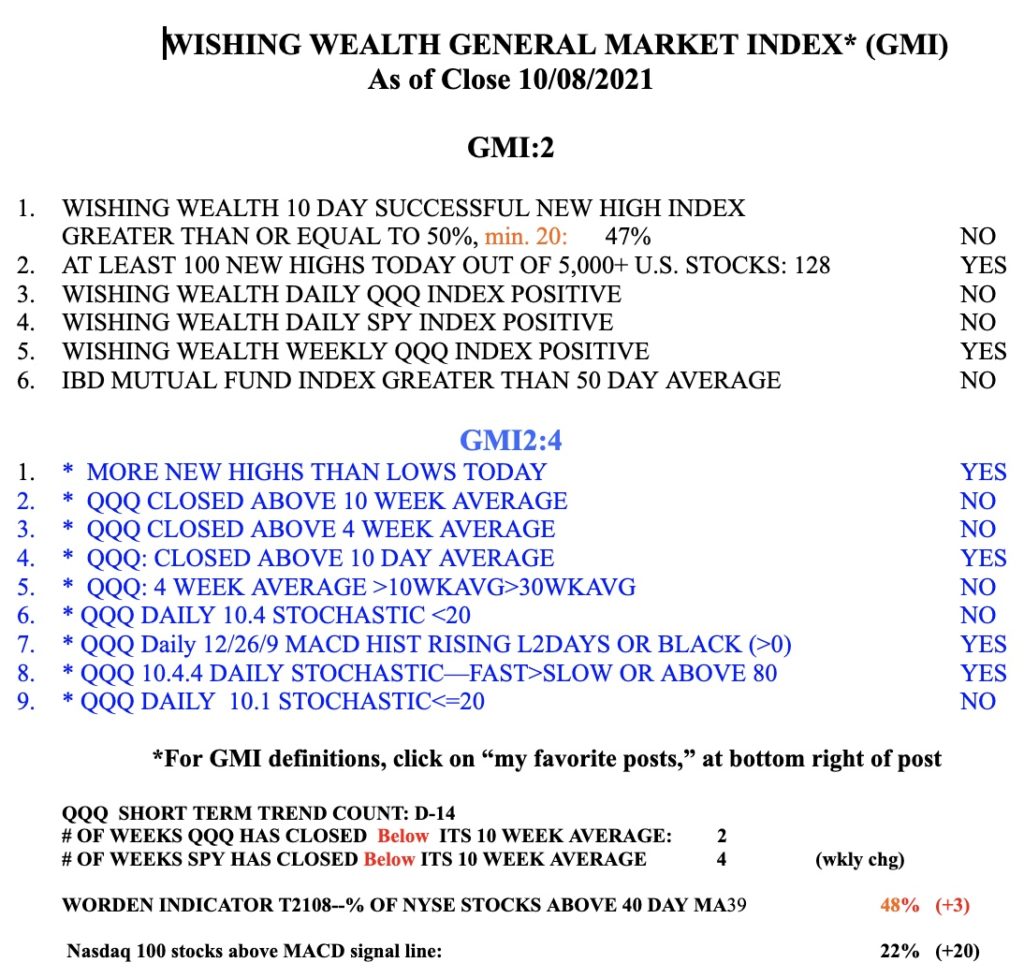
The GMI remains on a Red signal but in the past has been slow in catching bottoms. Only 40% of newsletter writers are bullish, down from over 60%. Remember, bottoms often occur in October and 3rd quarter earnings are about to come out. Watch how the market reacts to earnings as an indication of its health.
Hello Doc, did you notice that 9 out of your 11 “basketballs” are financial companies ! Time to buy a financial ETF ?