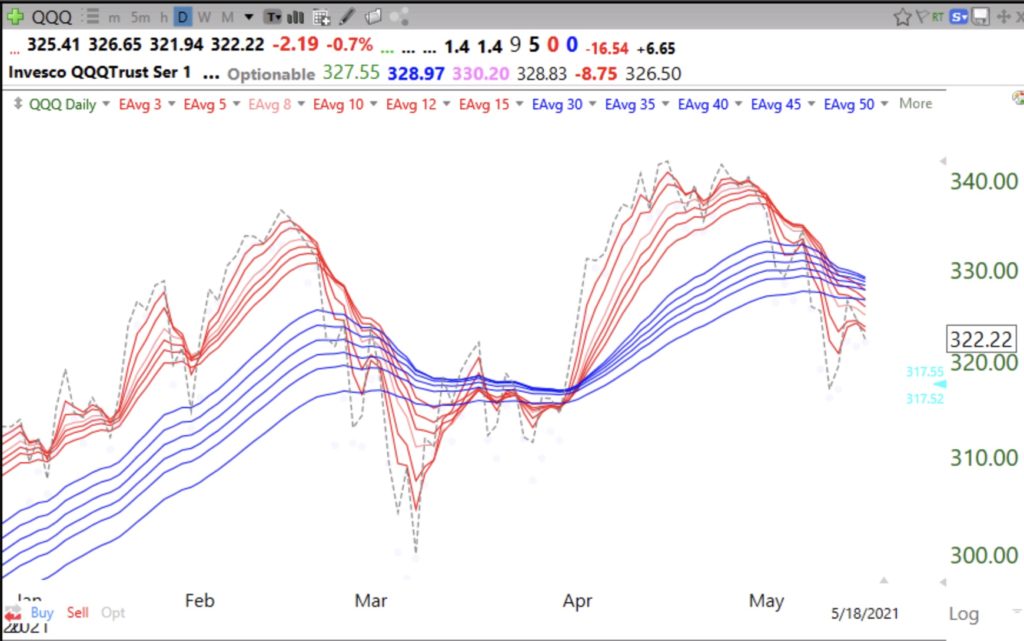
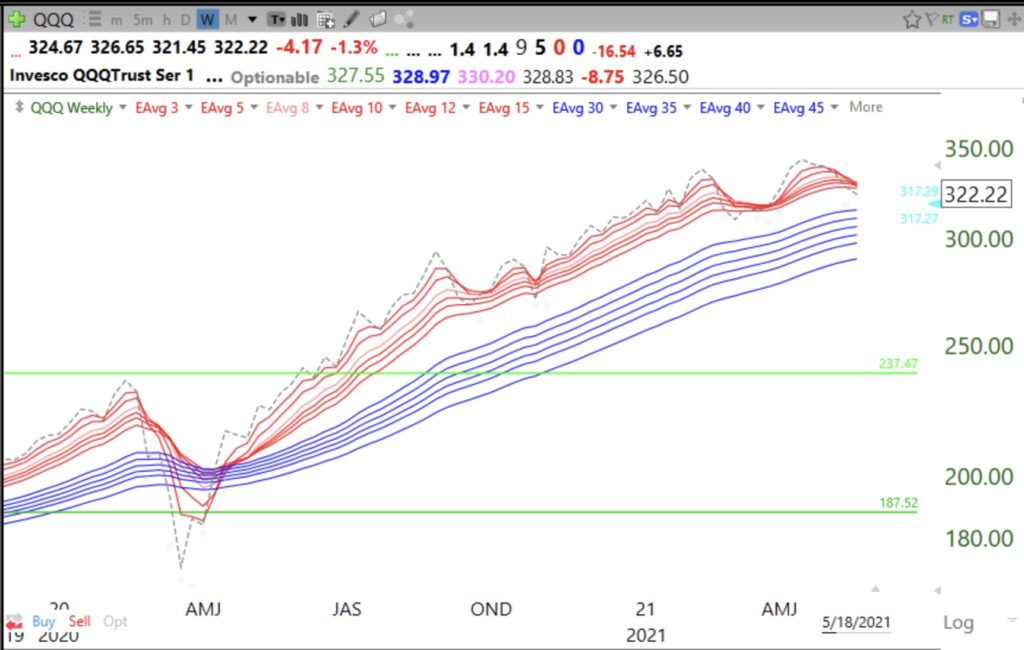
We are into the period of the post-earnings season lull when there is little to drive stocks higher. With futures down huge this morning, the GMI may close under 3 again and trigger a Red signal. It has been very hard to make $$$ on the long side during the past 10 days since my QQQ short term indicator turned down. I am concerned that the persons who have never experienced a long decline like 2000 and 2008 may be about to get a lesson about market risk. This daily GMMA chart (defined in blog glossary) shows that the QQQ is near to entering a BWR decline. Best to own stocks during a daily RWB up-trend. If we begin a weekly BWR down-trend, the bear will be upon us and I will transfer my university pension money into cash. That will signal the BEGINNING of a major decline. Daily GMMA chart:
Weekly GMMA chart:

