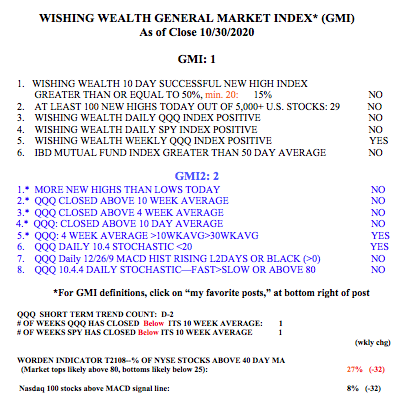
I have found that when the GMI is Red it pays for me to be mainly in cash–I am a chicken. A Red signal does not necessarily signify the beginning of a bear market, but it could be this time. It has been a long time since we have seen a traditional 10 month or longer bear market. We have a new generation of online stock jockeys who think that declines are rare and brief. The truth is that once a market turns down one never knows how long it will continue. The love affair with the FAANG stocks (FB, AAPL, AMZN, NFLX and GOOGL) will end someday. It may have already done so. Stocks do not climb forever and new leaders will always be born.
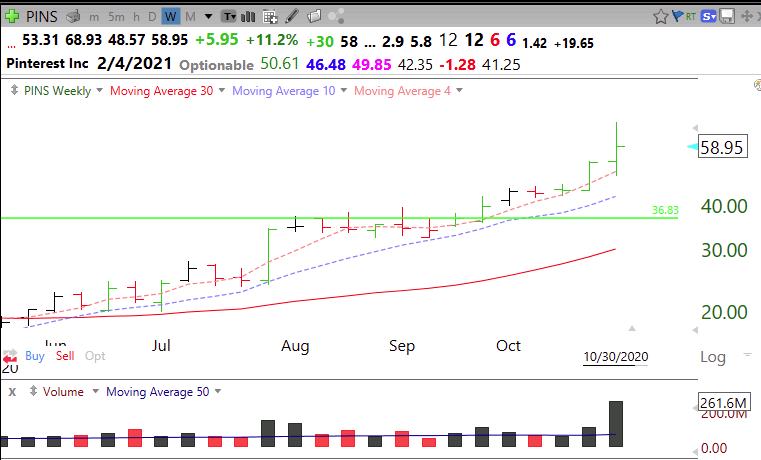
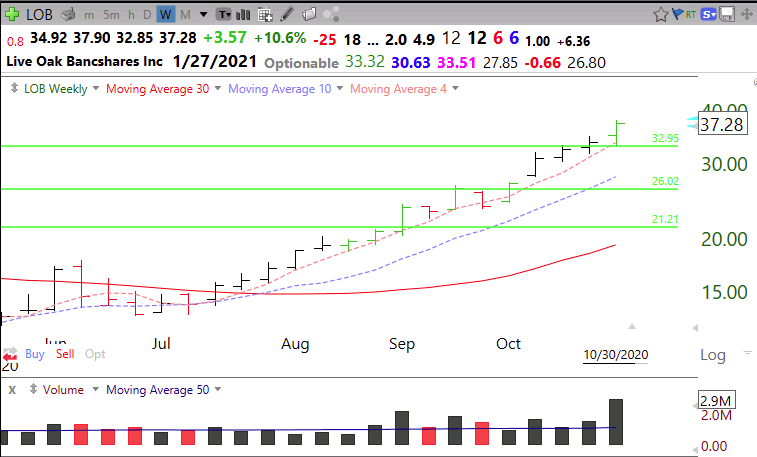
When the market is declining there are very few stocks hitting new all-time highs (ATH). The few that do are showing tremendous relative strength and may be among the new market leaders. It is so much easier to see the gems during a weak market. I ran a TC2000 scan of the 52 stocks that came up using the IBD scanner, that I described several weeks ago. These stocks, in addition to having other fine technicals and fundamentals, had tremendous sales and/or earnings. My TC2000 scan found that only 2 of these 52 stocks hit an ATH last week and closed higher on weekly volume that was at least twice their average. PINS and LOB each had a weekly green bar (WGB) and a recent green line break-out (GLB). If I could not resist the temptation to buy one of these stocks I would place my initial stop loss below last week’s low. Below are their weekly charts. They should not trade back below their 4 week averages (red dotted line). But these days many break-outs fail. CHWY was an example of a failed cup and handle break-out last week. In a weak market people are scared and take their profits quickly. So break-outs and advances are brief and fail.
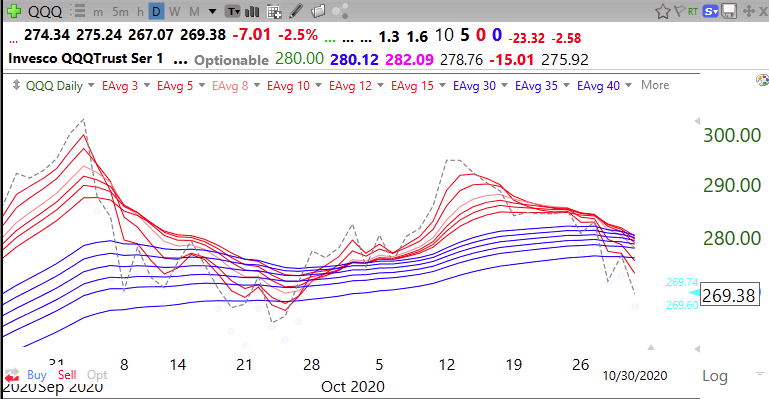
Speaking of failures, the failure of October’s rally to surpass September’s highs was a major sign of technical weakness, as this chart shows. If the pattern should become a BWR with all of the red lines (shorter averages) below the blue lines (longer averages) we could be in for a major decline. However, if the QQQ can close (dotted line) back above all 12 averages, the up-trend could resume. The market will reveal its intentions soon. I react after the signal, not before…….. (I am a trend follower)….
The GMI has been less than 3 for two days, triggering a Red signal. If the GMI should eventually register zero, it would signify the end of a Stage II up-trend and major weakness.


