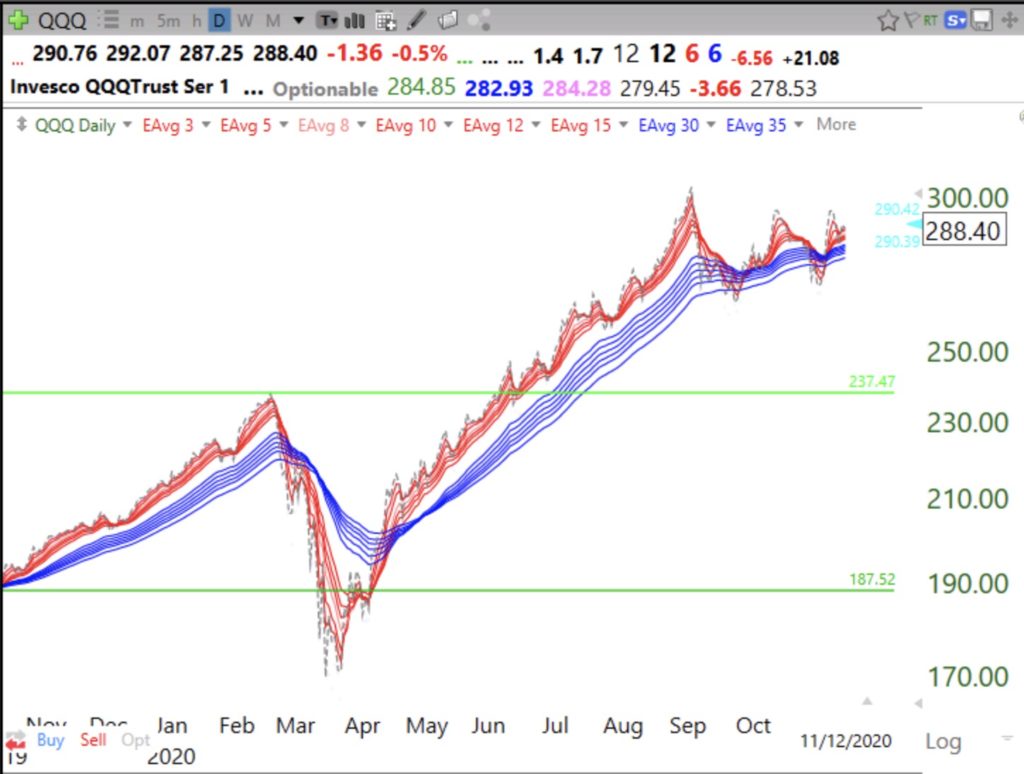
RWB up-trend pattern=shorter term averages (red) rising well above rising longer term averages (blue). Dotted line is daily close and leads all averages. Current QQQ market remains in a lateral trading range until it breaks up or down and forms a consistent RWB or BWR pattern (see BWR down-trend last March). Much more difficult to make money now by buying growth stocks.
