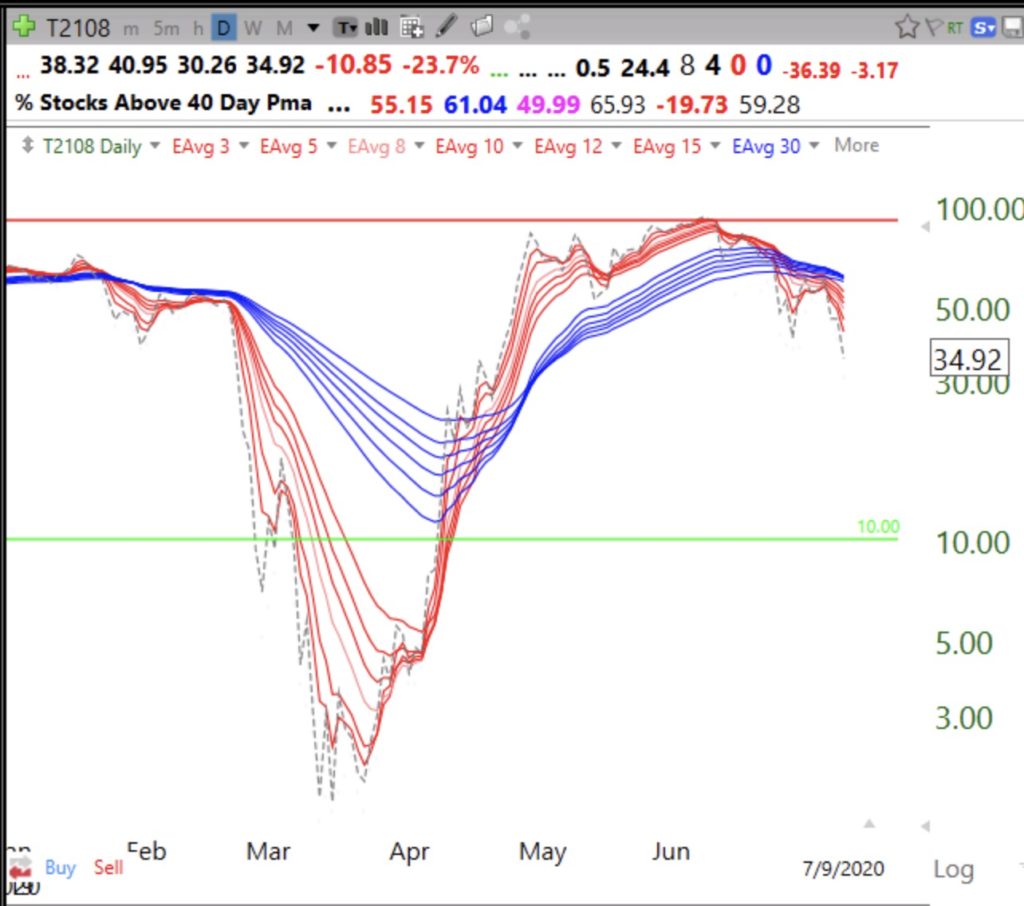
While I typically only use T2108 below 10% (% of NYSE stocks above 40 day average) as an indicator of bear market bottoms, I have recently noticed how well it can show developing weakness. As occurred in the huge decline last March, T2108 appears to be entering a daily BWR pattern. The weakness in the Dow 30 and large cap industrial and financial stocks may be spreading. Note Thursday’s decline (dotted line) to a recovery low. I remain very cautious, holding GLD and a few inverse ETFs (FAZ, SDOW).
