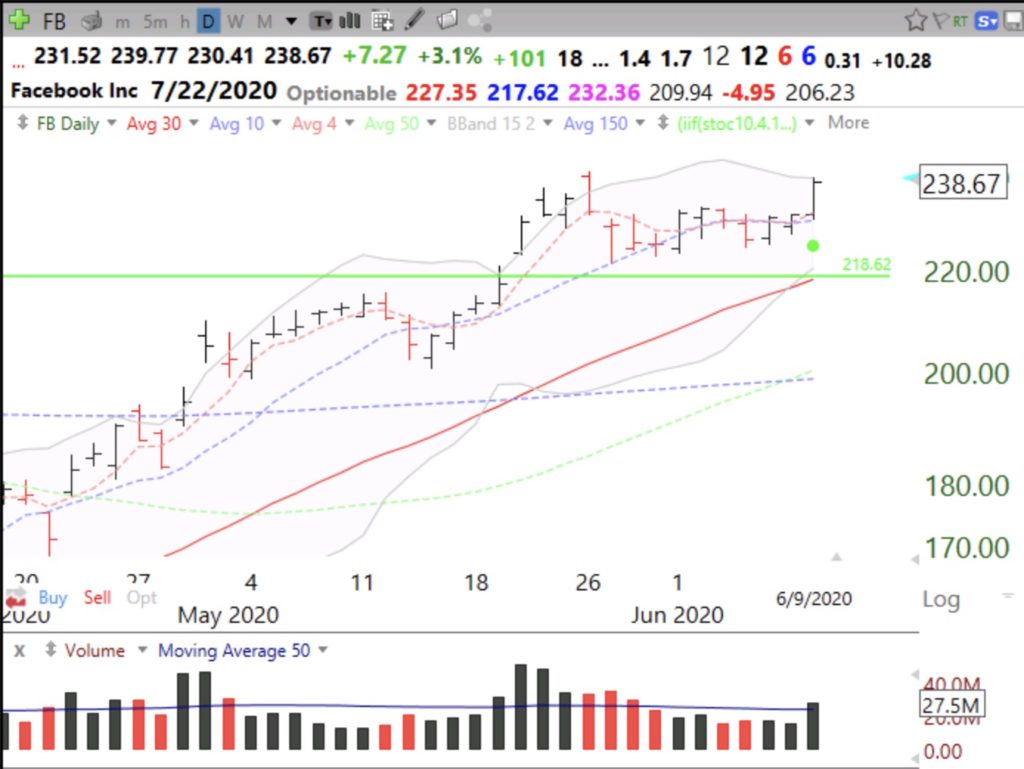
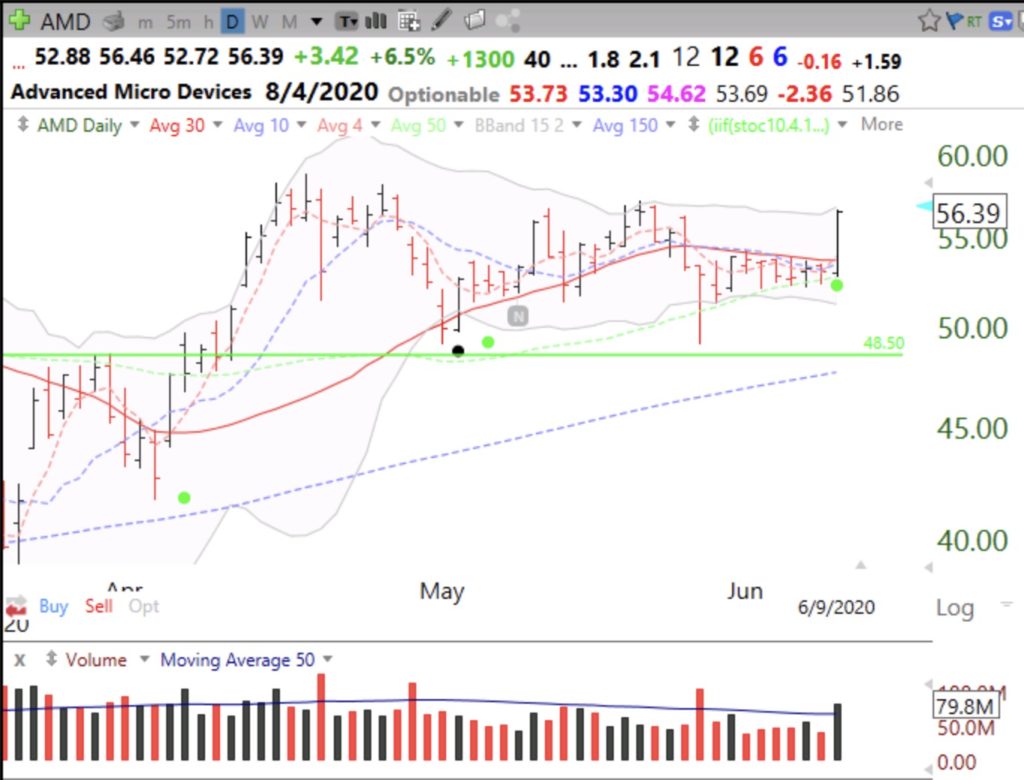
I tweeted on Tuesday (@wishingwealth) that FB and AMD had green dot signals. A green dot signal occurs when the fast 10.4 daily stochastic crosses above the slow daily 10.4.4 stochastic. You can see the green dot drawn on the charts below. Note that both of these stocks are above their last green line tops, a critical requirement for me. They also had recent green line breakouts (GLB). Note the above average volume on their green dot signals.
If you have TC2000 you can find a free tutorial for putting the green dot signal on your charts at my club (Dr. Wish) by going here or to www.wishingwealthblog.com/club.

