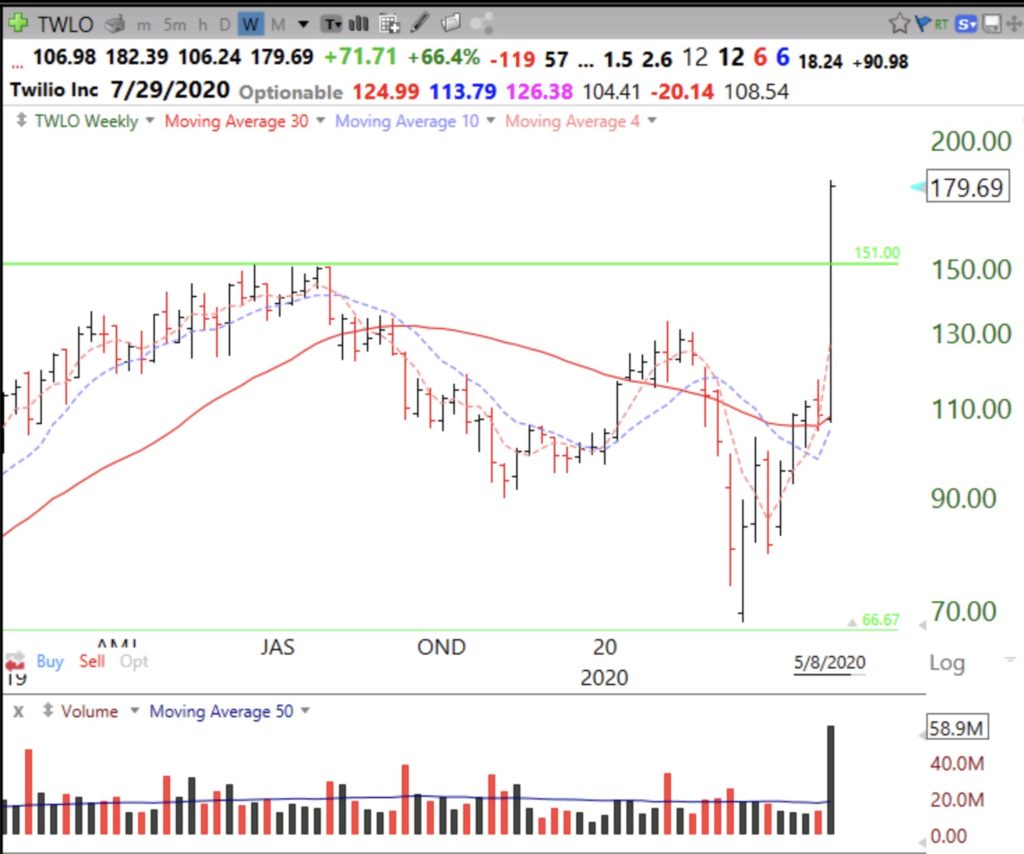
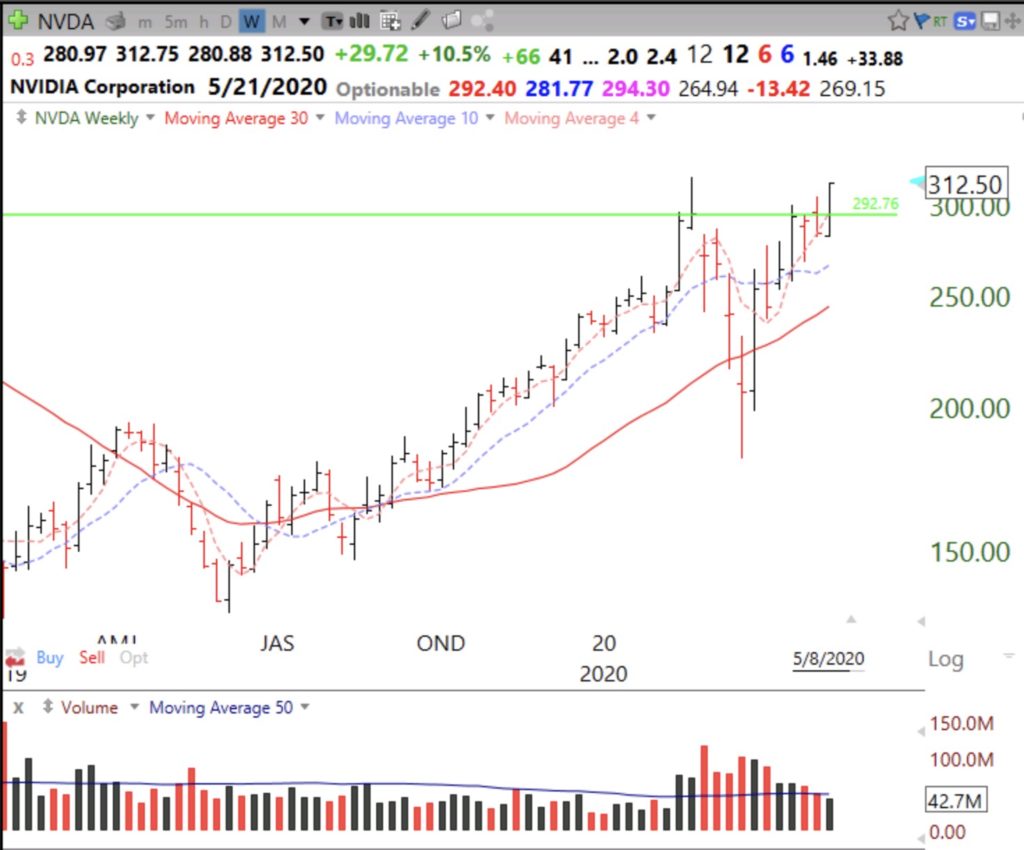
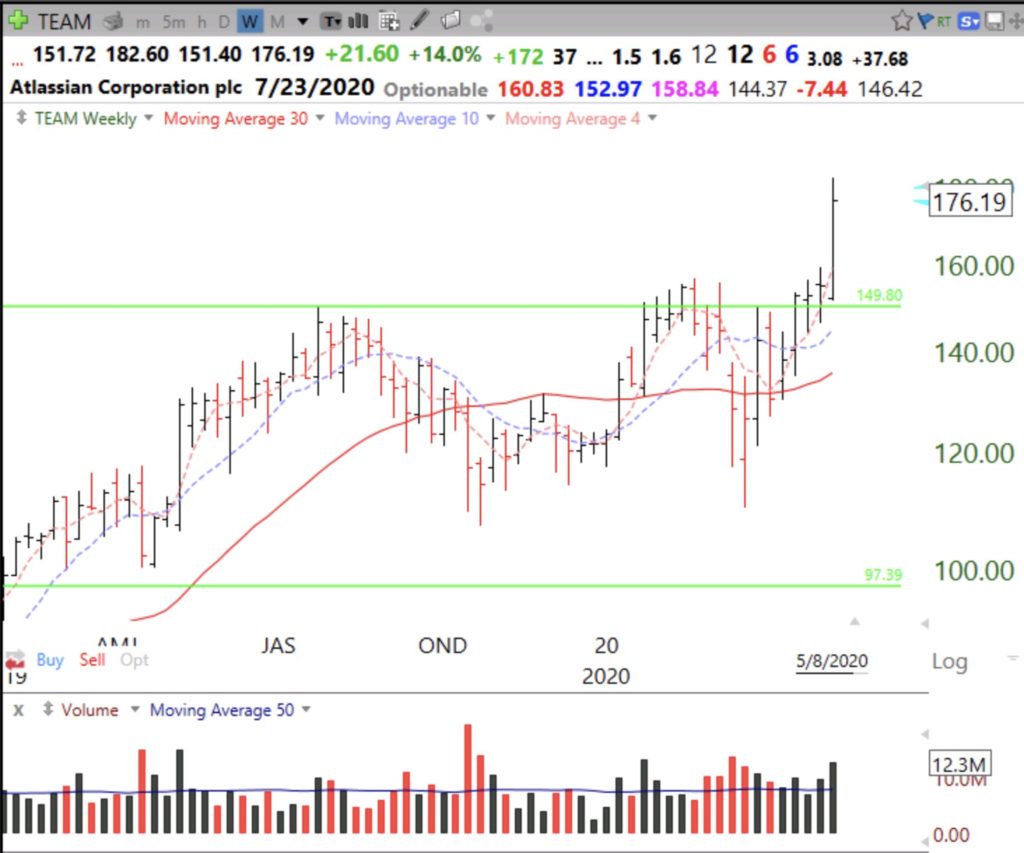
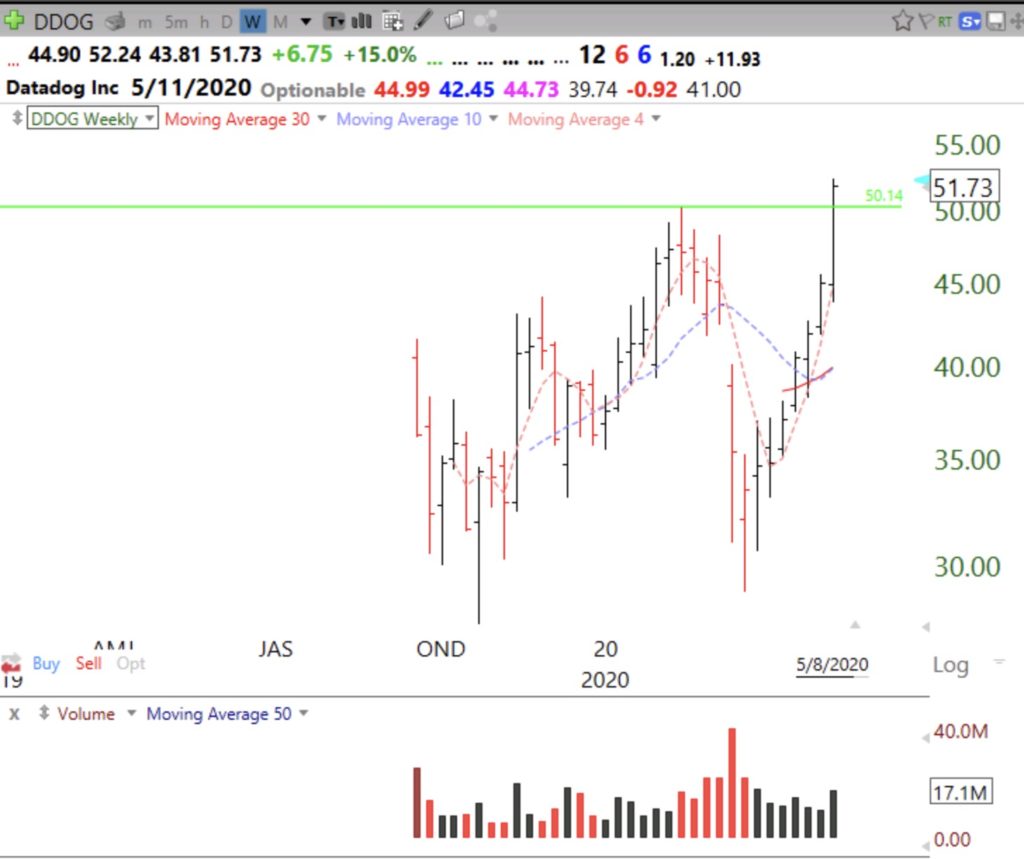
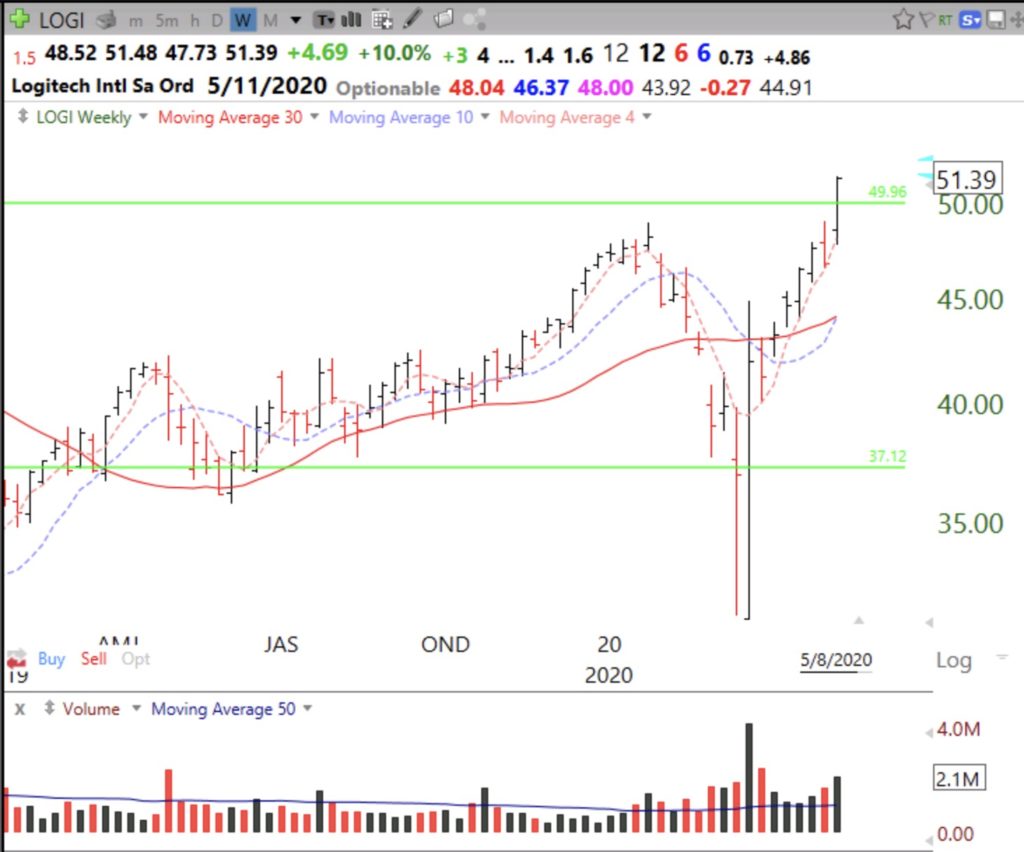
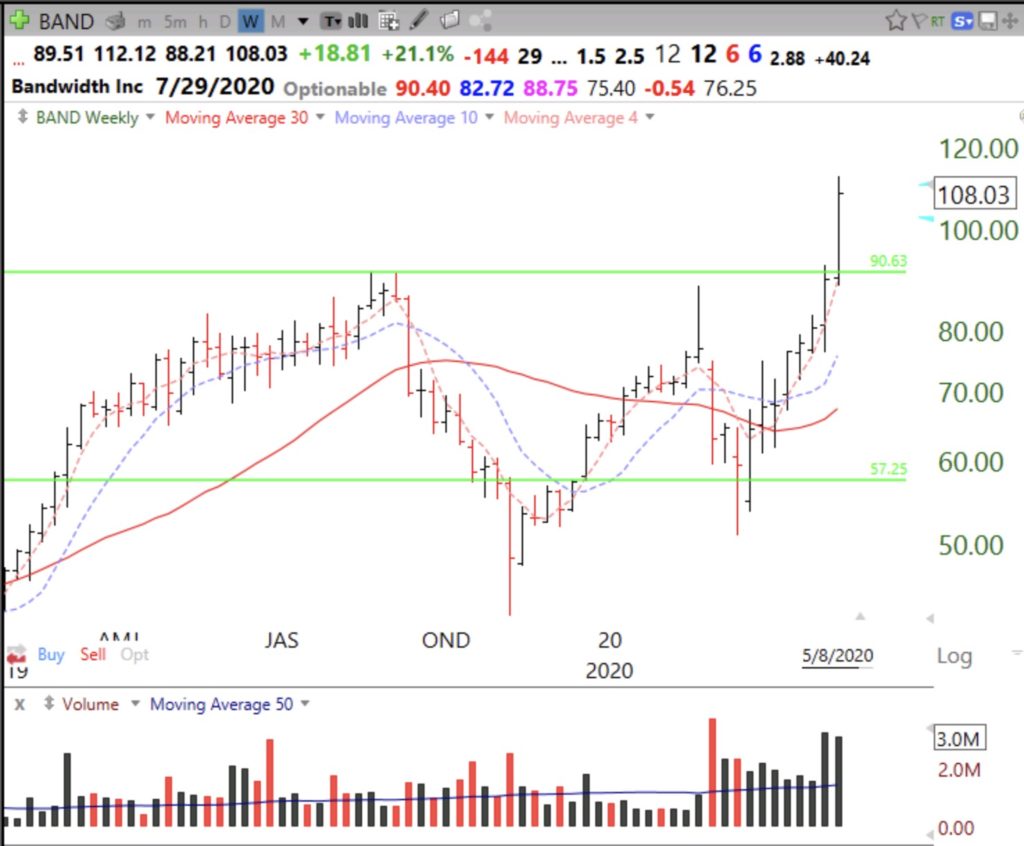
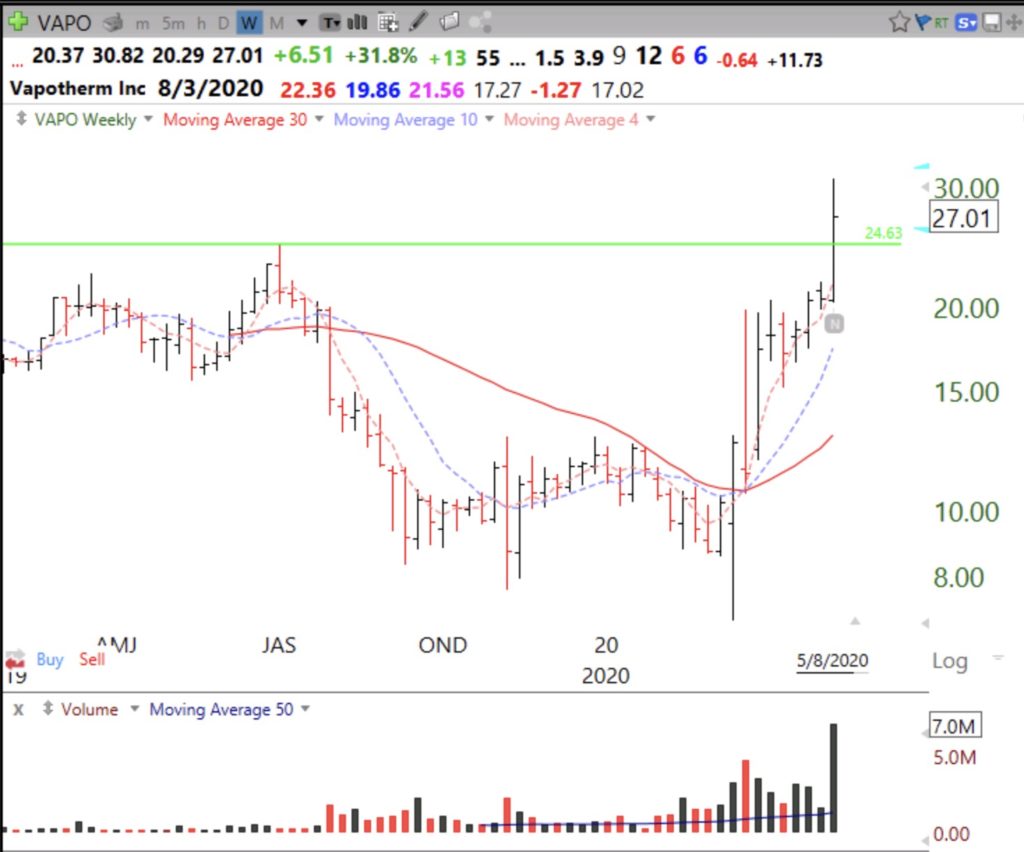
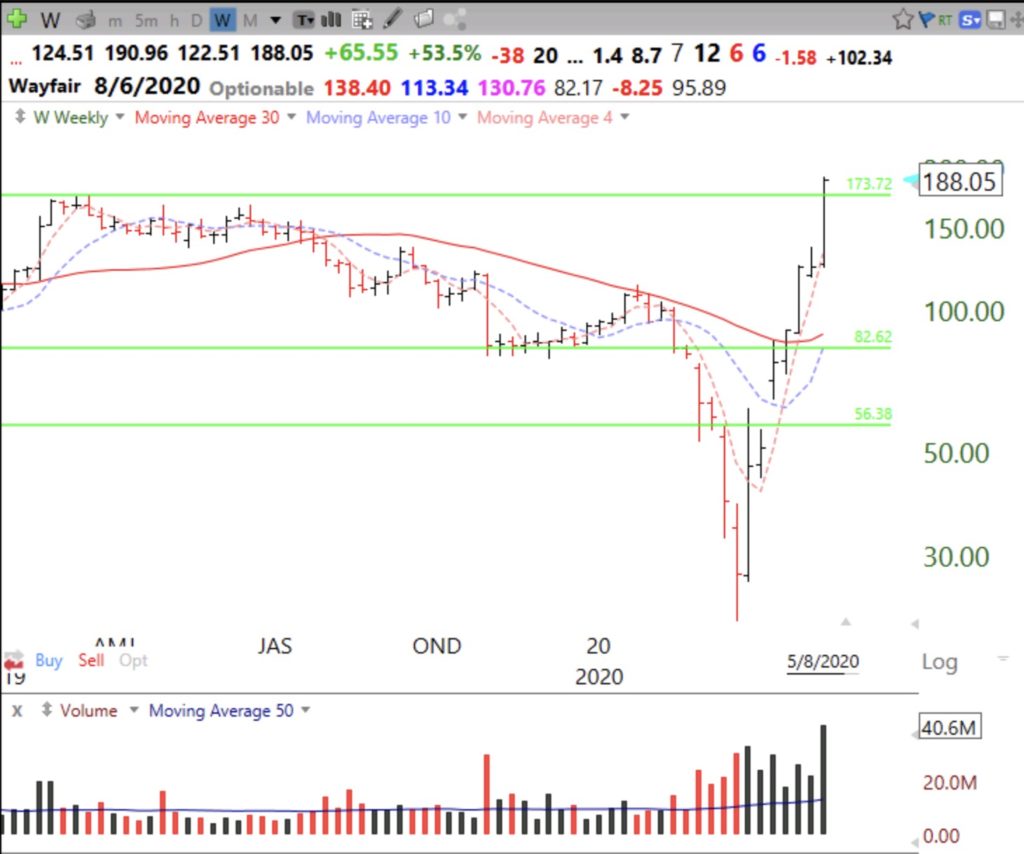
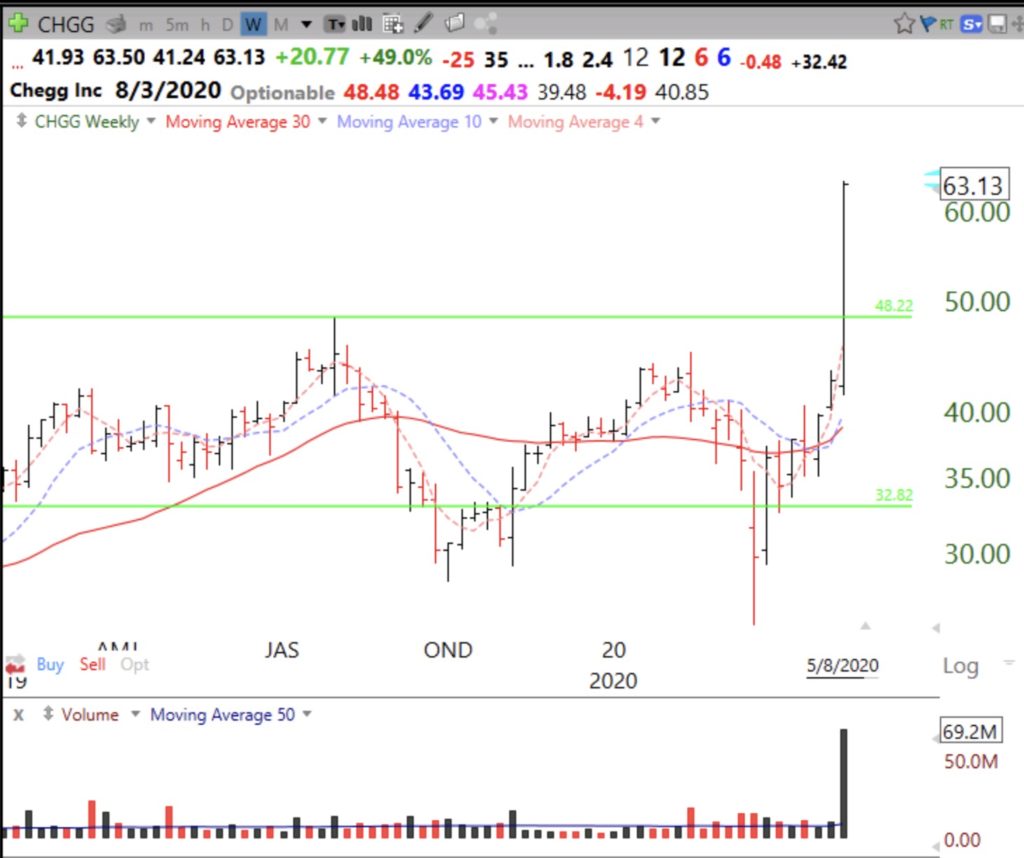
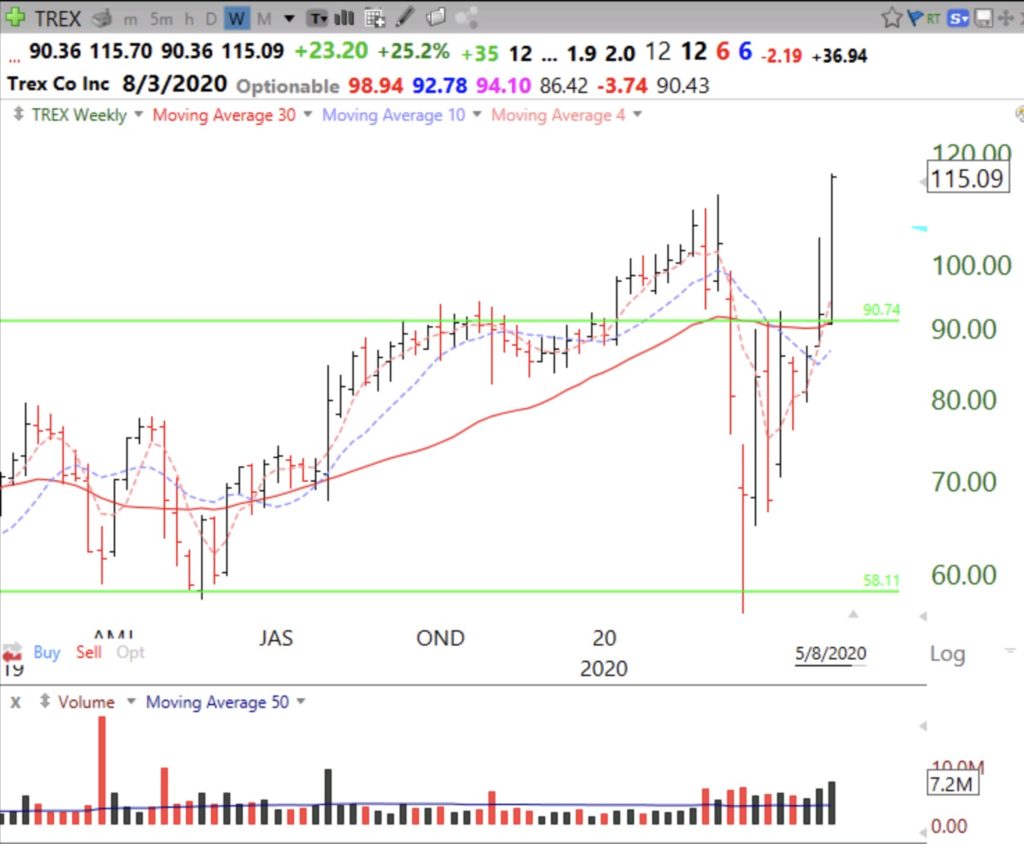
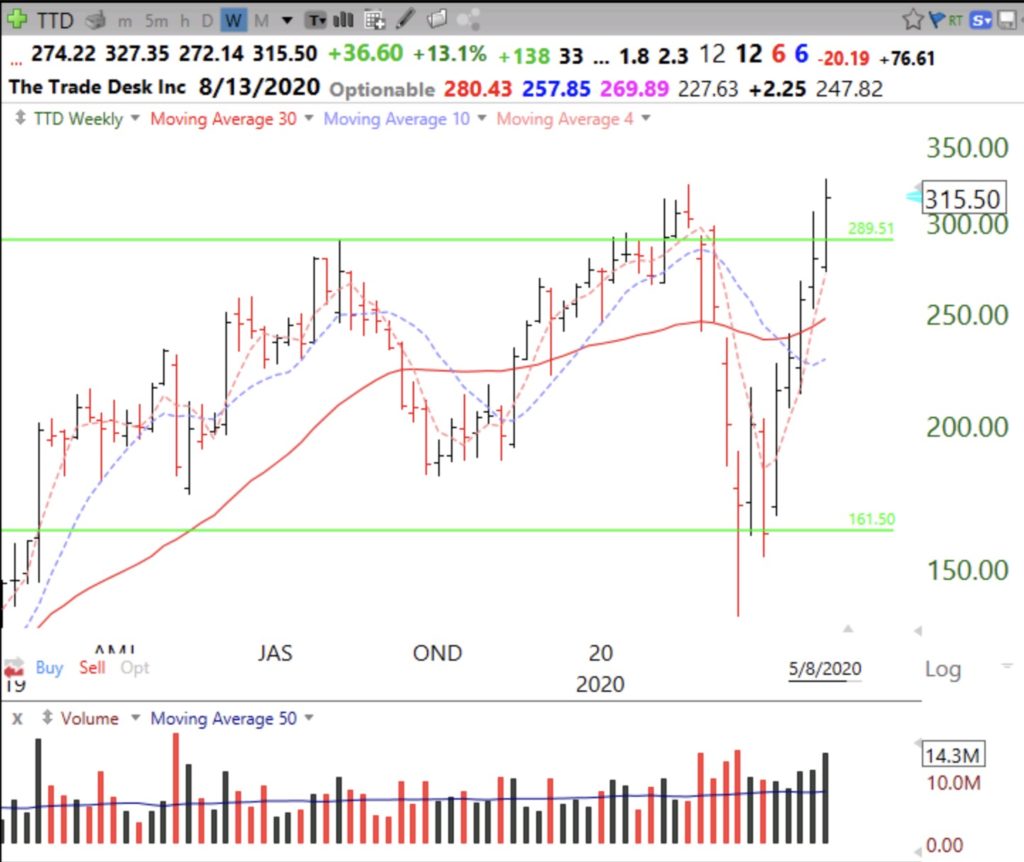
A GLB is a green line break-out. It signifies a stock that has hit an all-time-high (ATH) that is subsequently not exceeded for at least 3 months and then breaks out to a new ATH. While not all winners, some GLBs go on to do very well. I like to see above average volume on the day of the GLB. If the stock closes back below its green line, it is a failed GLB and I sell immediately but will buy it back if it retakes the green line. The green line is drawn at the peak price on a monthly chart. I often buy GLBs on the day of their break-out if I see them. (I use TC2000 to alert me intraday of a GLB.) Otherwise I wait for the stock to consolidate and bounce off of support or break out again. Here are weekly charts of stocks that had a GLB last week. They need to be researchers and evaluated before buying.
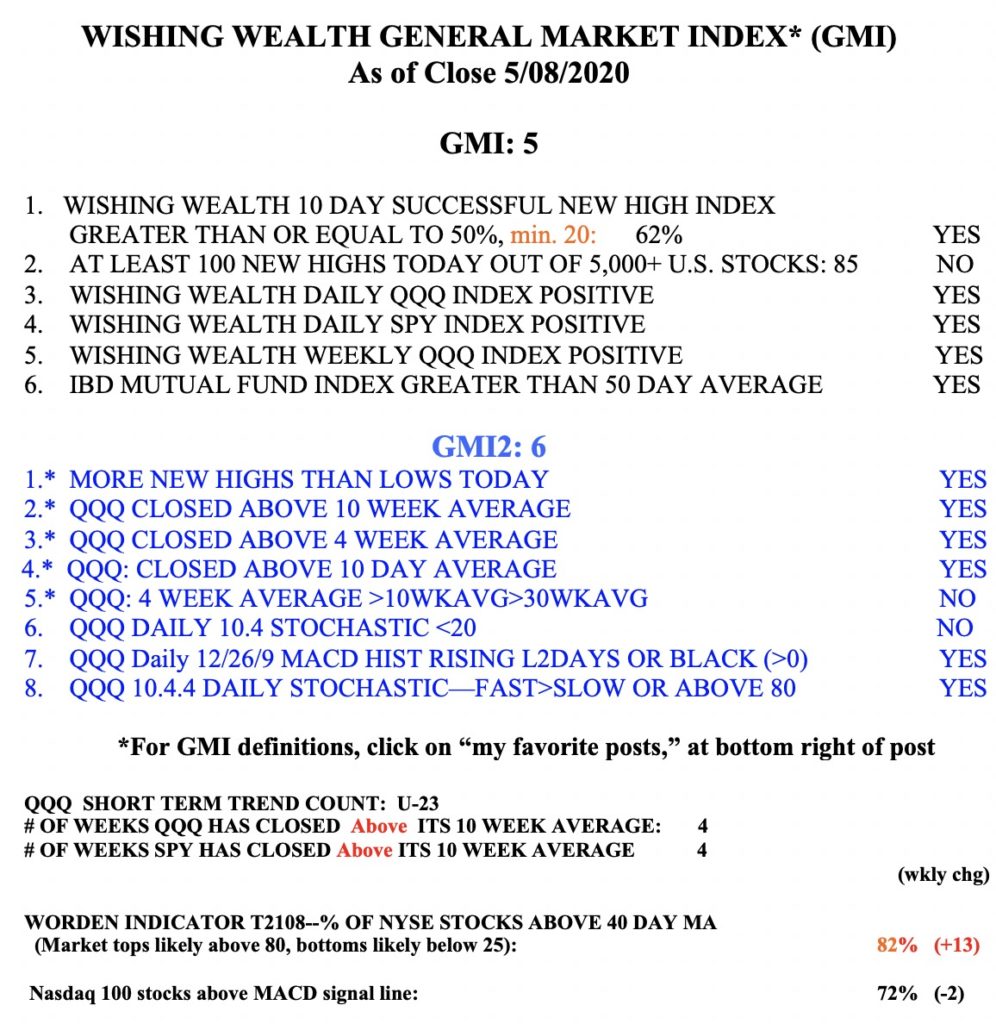
The GMI remains on a Green signal.
