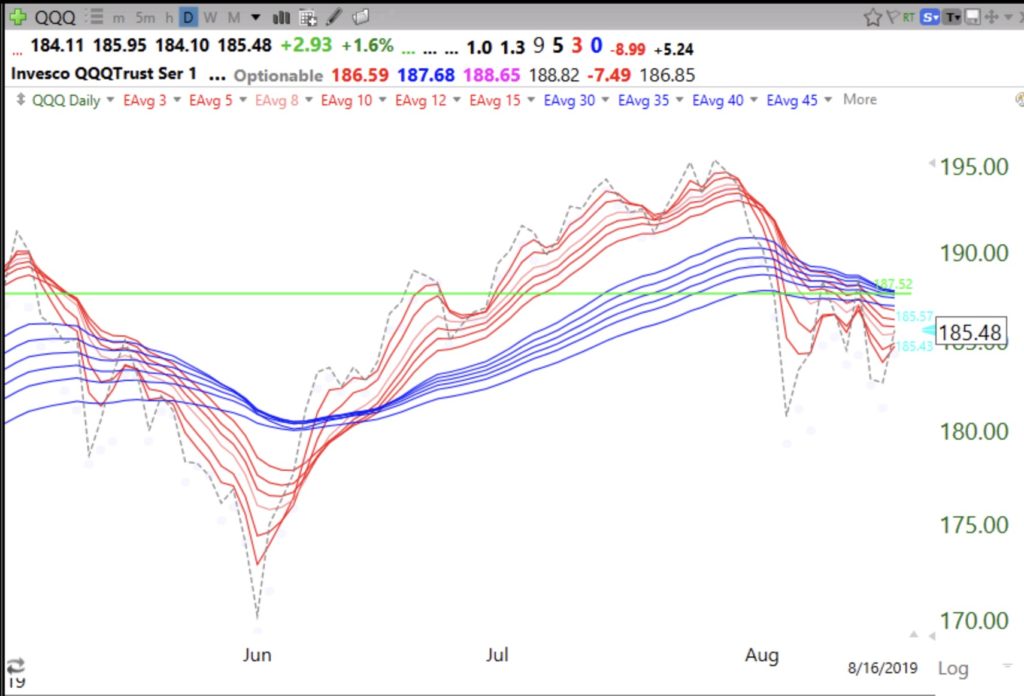
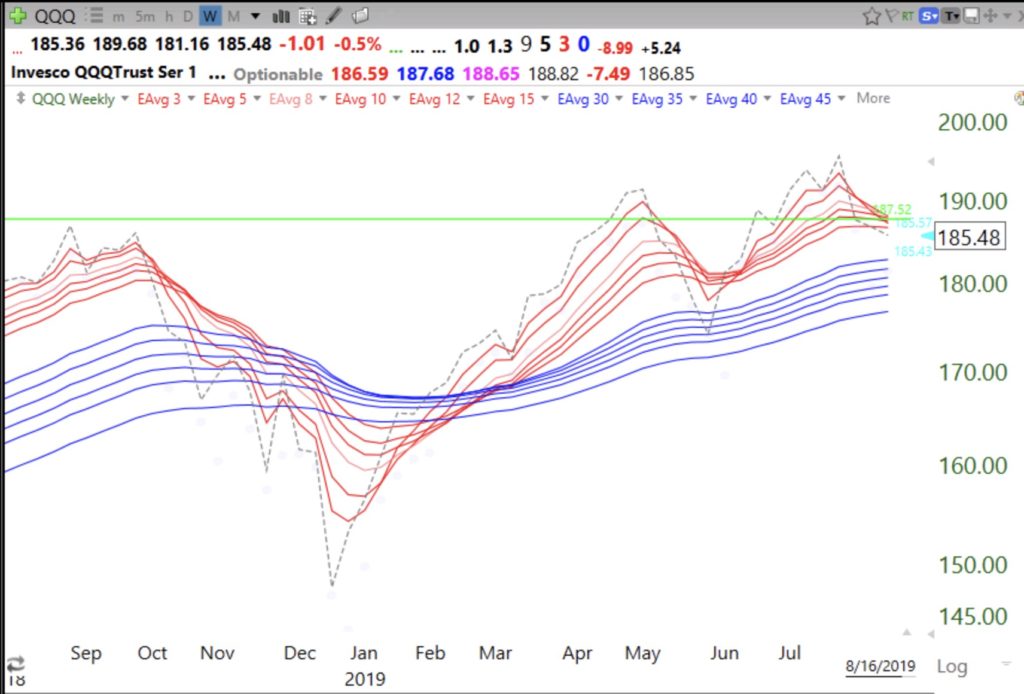
I like to compare the Daily Guppy chart to its weekly equivalent. The daily chart is in a down-trend while the weekly chart remains in a RWB up-trend. I therefore remain invested in my pension accounts which are long term but am in cash in my shorter term more nimble trading accounts. Check out the two chart patterns.
Weekly RWB pattern since last March!!! June decline and current one appear minor in a weekly chart.


Have you ever compared rates of return between the two approaches?