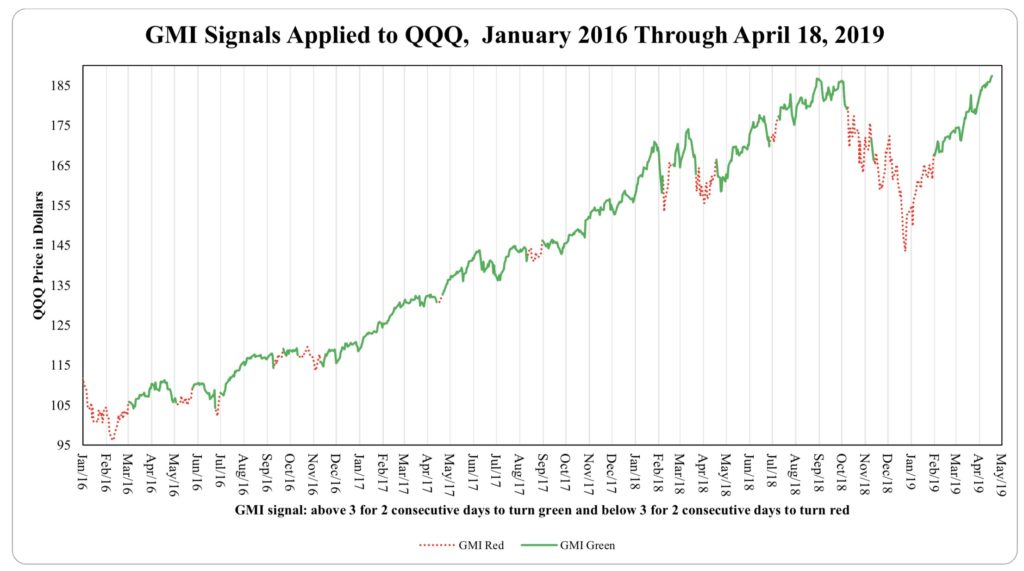
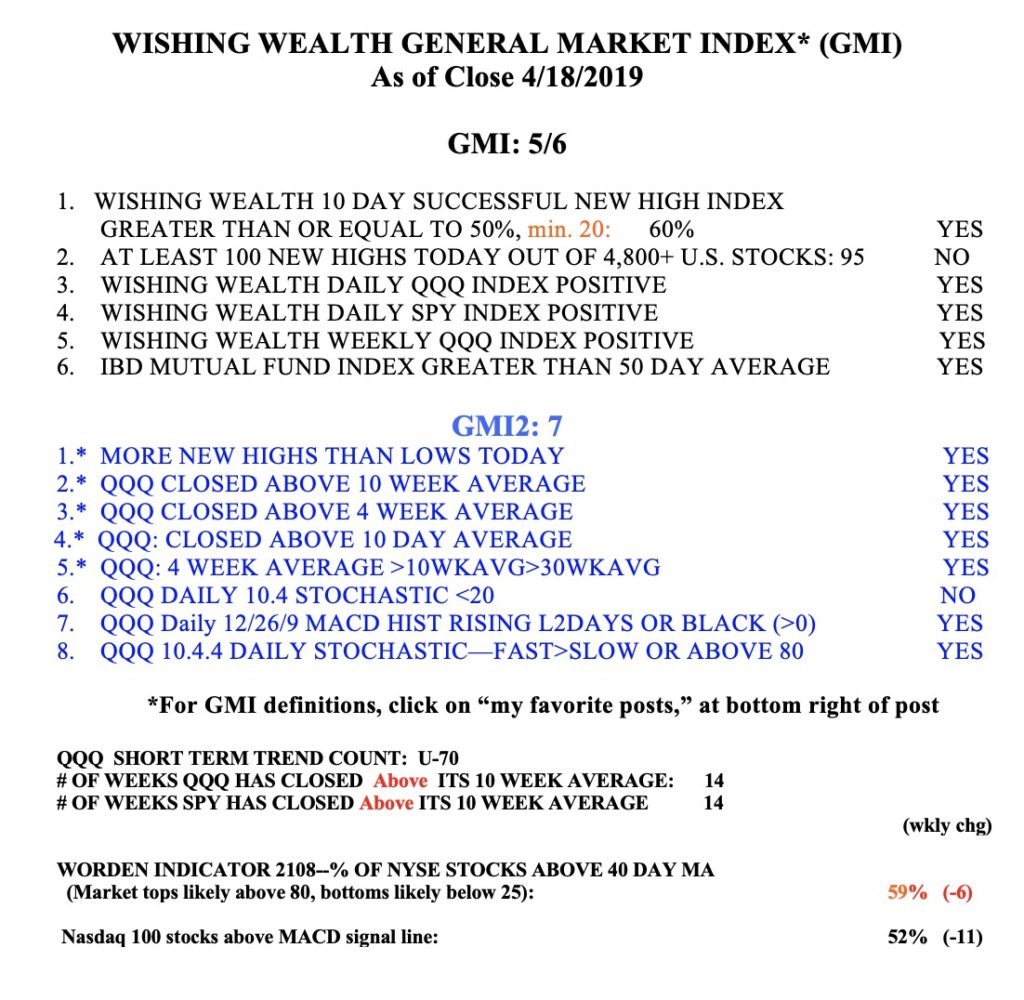
Every day after the market closes I compute the GMI total (out of 6) and post the current Red or Green signal. The chart below shows how the QQQ has acted during the times of a Red or Green signal The criteria for a change in color are described below the chart. The GMI helps me to trade consistent with the longer term trend of the market. The GMI is currently at 5 (of 6) and remains on a Green signal.


VERY IMPRESSIVE TRACK RECORD, DR WISH.
THANKS SO MUCH FOR SHARING!
How can I use the GMI to create buy/sell/hold rules.. Do you post it in every blog.
Thank you Dr Wish for sharing your signal history. You are a treasure! I follow you on twitter and check your blog several time per week. Thank you for the great work you do.