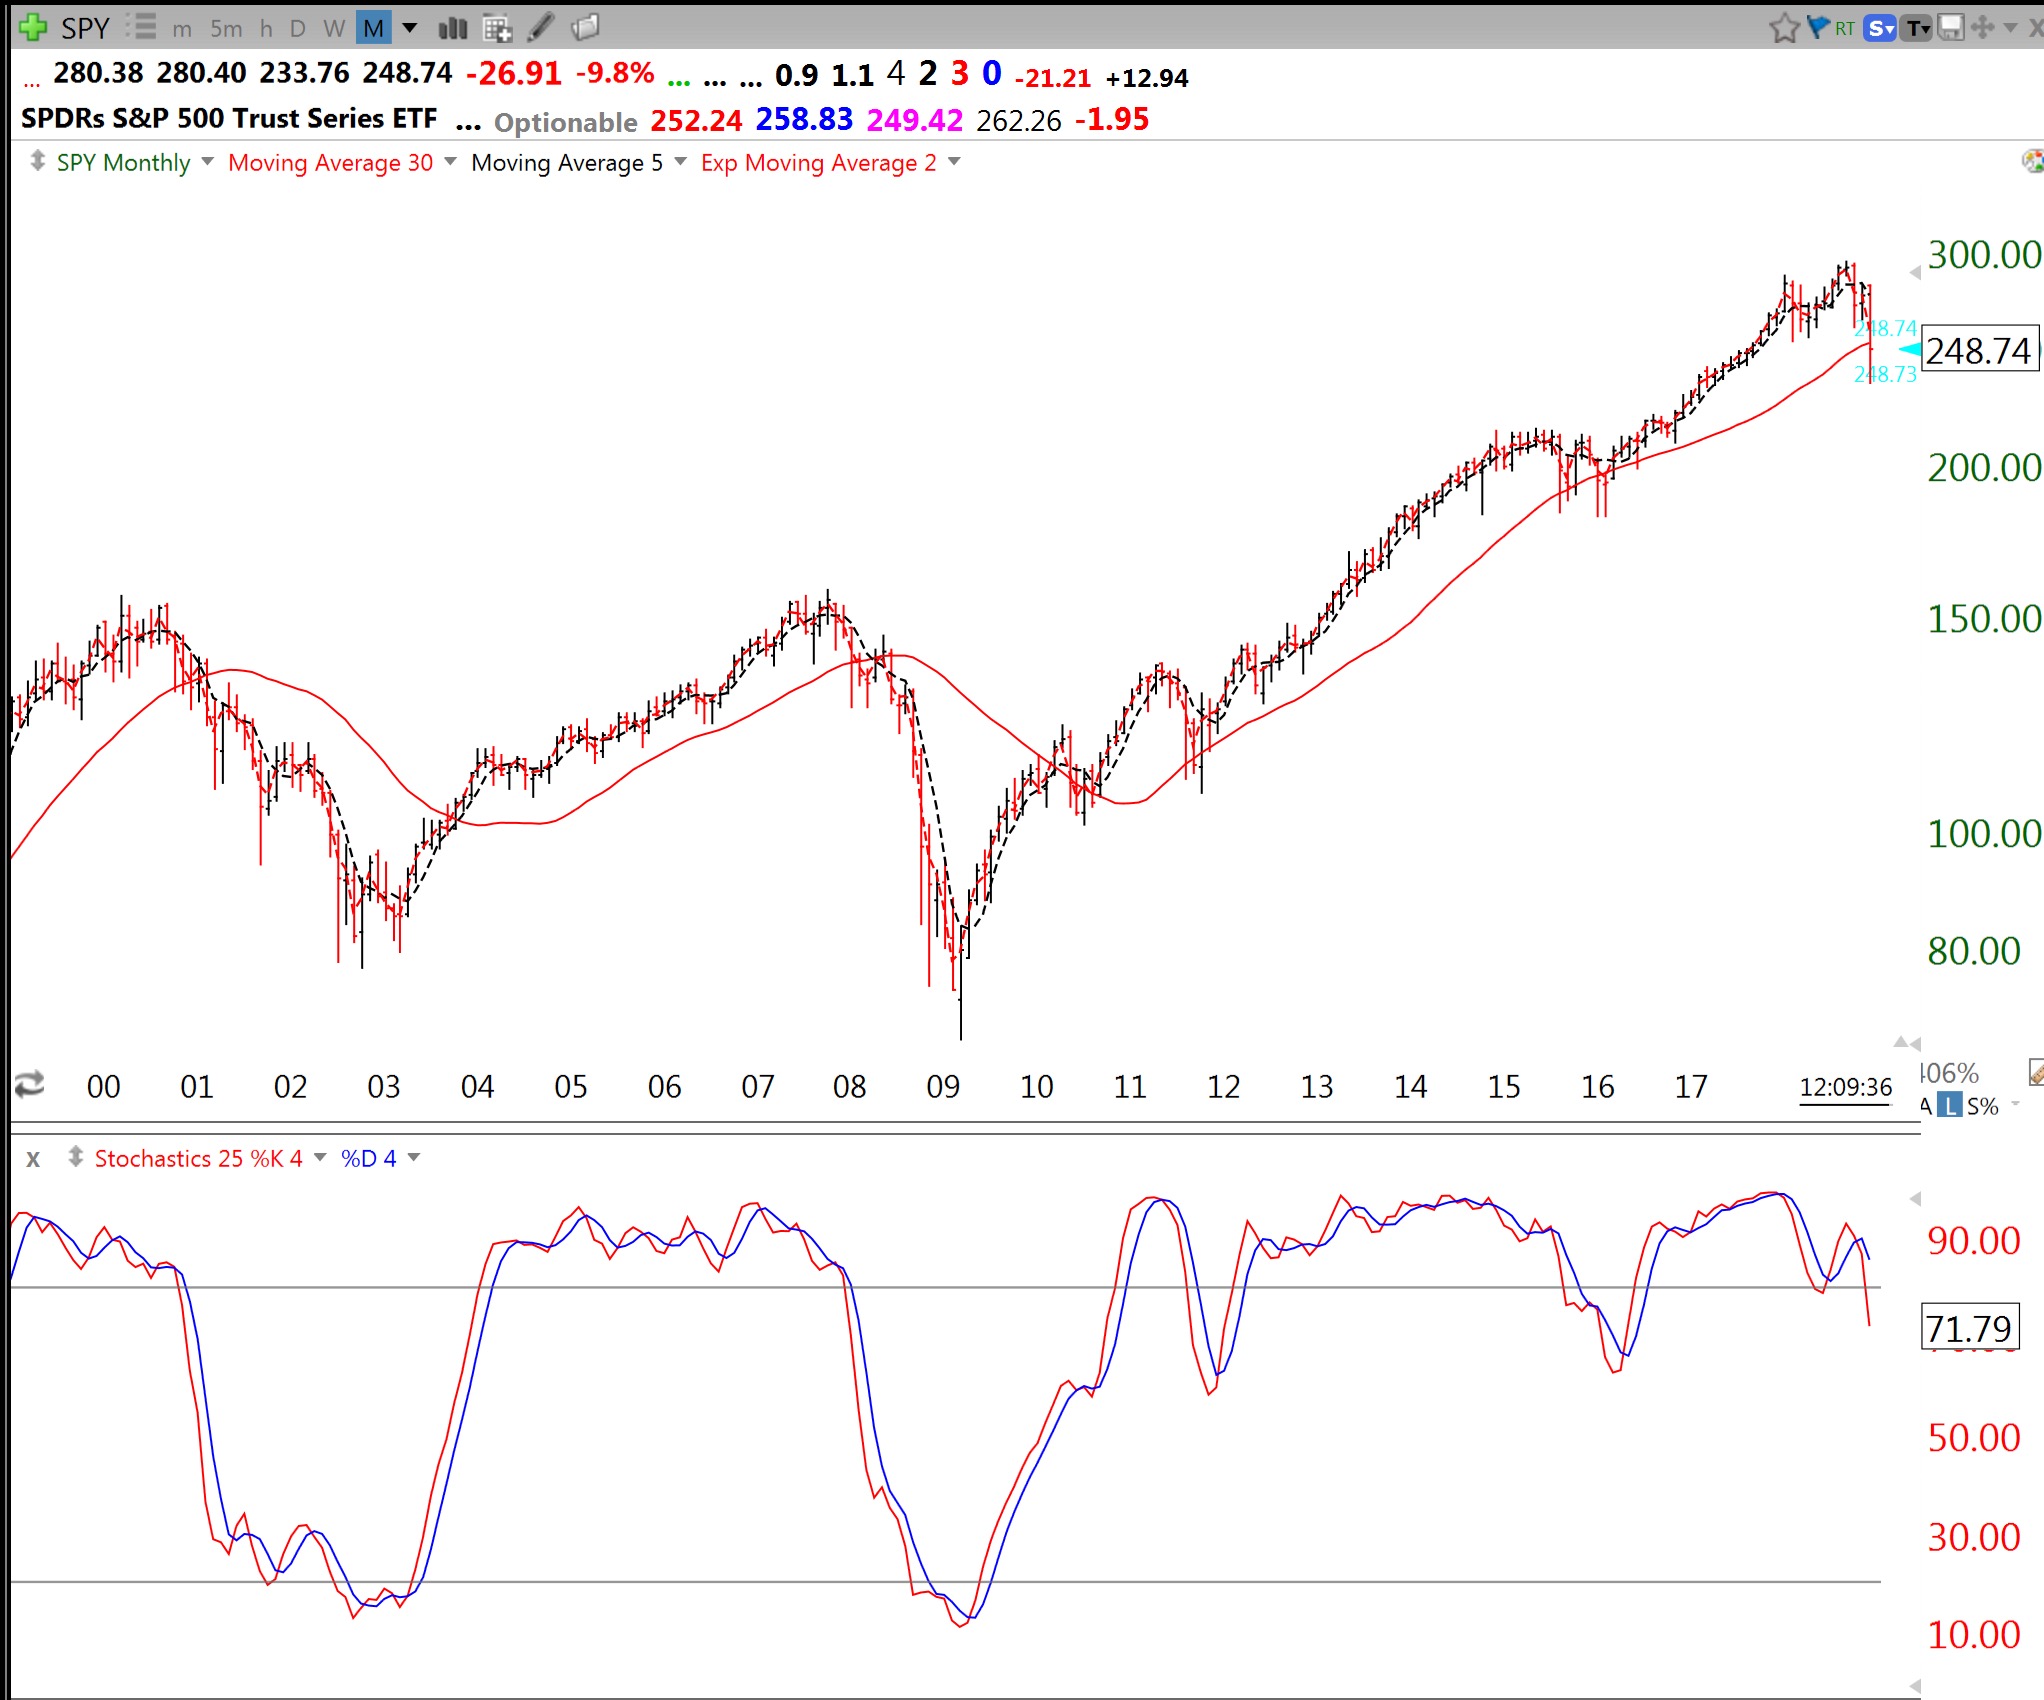
This monthly chart of the SPY tells the story. Below the SPY is the 24.4.4 monthly stochastic. Note that at the 2003 and 2009 bear market lows the stochastic reached oversold levels, well below 20. In the small 2012 and 2016 declines the stochastic fell to around 60. The current reading of 71.79 shows how weak this decline has been. If this Stage IV decline really gets going, the monthly stochastic gives me a way to assess its strength and likely bottom. I am content to be in cash on the sidelines.

Thanks for the long-term perspective, Dr. Wish. I find it very instructive.
Great chart Dr. Wish. I use a similar chart so I added the stochastic you referenced just to do a side-by-side comparison.
Dr. Wish thanks for the added perspective. Gregg
Wow that is a great nugget of info regarding the stochastics….Thank you !
I find daily 1.4.4 stochastic and 15.2 bollinger bands to be great timing devices as long as I follow the stock’s primary trend.
Thank you!
Keep me posted on your observations please.
Thank you!