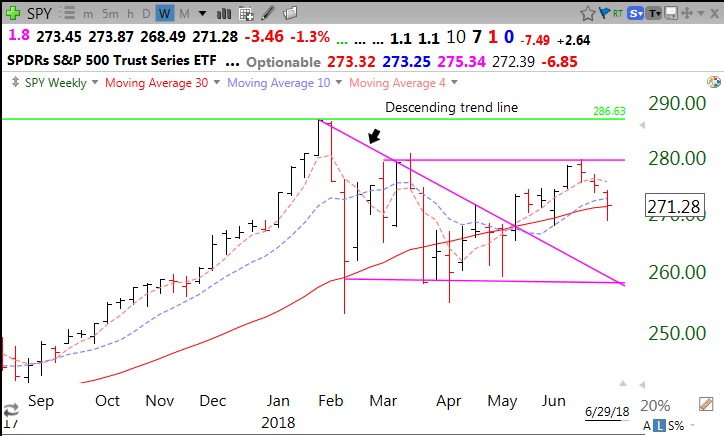
This is a critical week for the market. Failure of the SPY to hold its 30 week average (solid red line) will suggest to me a failed rebound and the likely beginning of a Stage 4 down-trend. Weakness is likely now anyway because of the end of the 2nd quarter and associated mutual fund window dressing. The 4 week average (red dotted line) is now curving down, a sign that the recent rebound is over. The time to be in the market is when the 4 week average is climbing, as was the case during much of 2017. That is when making money on the long side is much easier. The SPY would have to retake its 4 week average for me to buy stocks again.
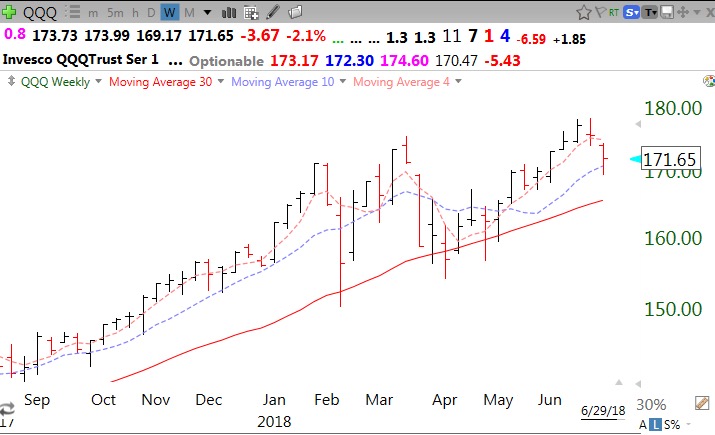
The 4 week average of the QQQ is also turning down, but the QQQ is stronger, as it remains well above its 30 week average.
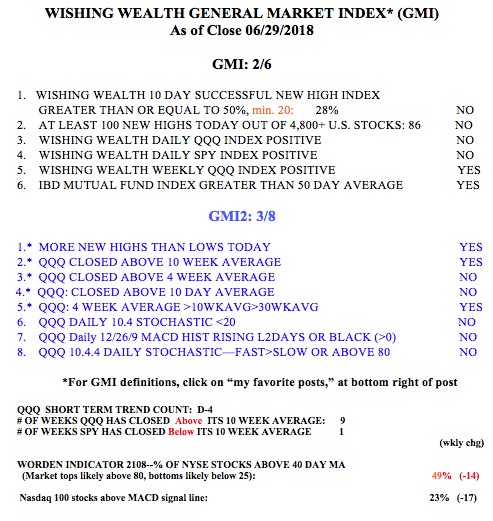
The GMI remains Red, at 2 of 6. I changed the 6th component of the GMI2, substituting an oversold daily stochastic for a close of the QQQ above its 5 month average.


Hello. Do you have a web page that explains what the “Green Dot Signal” is?
Thanks,
Mike