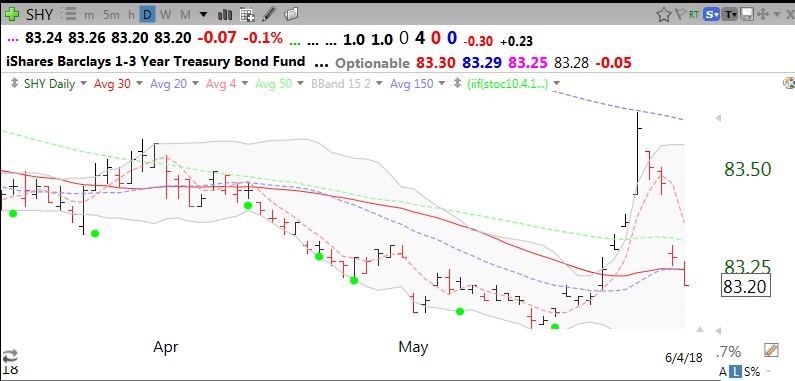
$SHY is an ETF of 1-3 year treasury bonds and reflects the Fed’s intention on short term rates. This daily chart shows the resumption of the decline in SHY, representing a rise in short term rates, after a recent dead cat bounce.
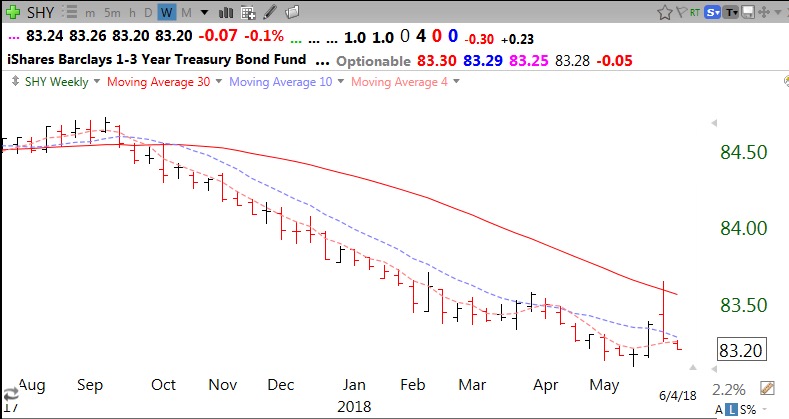
The longer term Stage IV decline in SHY is very evident in this weekly chart. Last week SHY kissed its declining 30 week average (solid red line), then reversed. Rates are clearly going higher and will eventually choke the bull and the economy….

