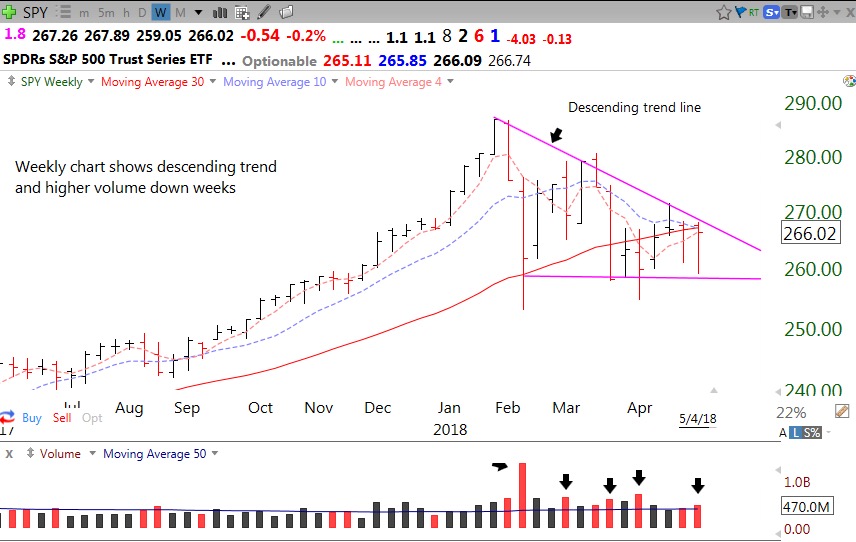
The SPY is up against its descending down-trend and still below its 30 week average (solid red line) and 10 week average (blue dotted line).
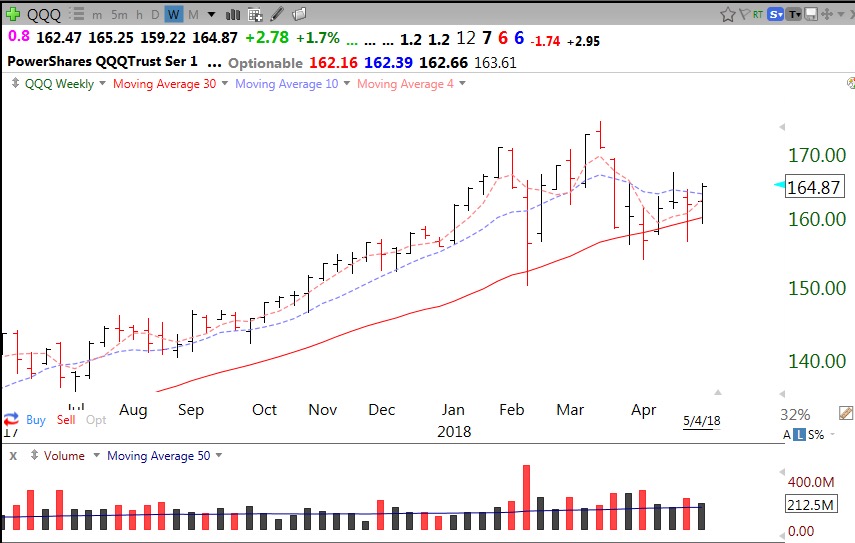
But the QQQ looks stronger and is holding above its rising 30 week average and has regained its 10 week average. Note the higher volume down weeks too. Which index will lead the other?
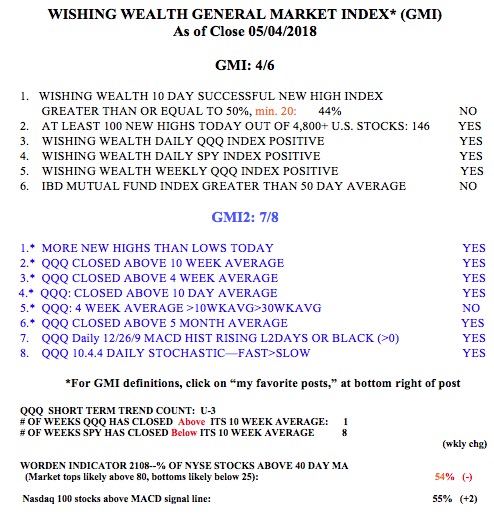
The GMI = 4 (of 6) and remains on a Green signal.


