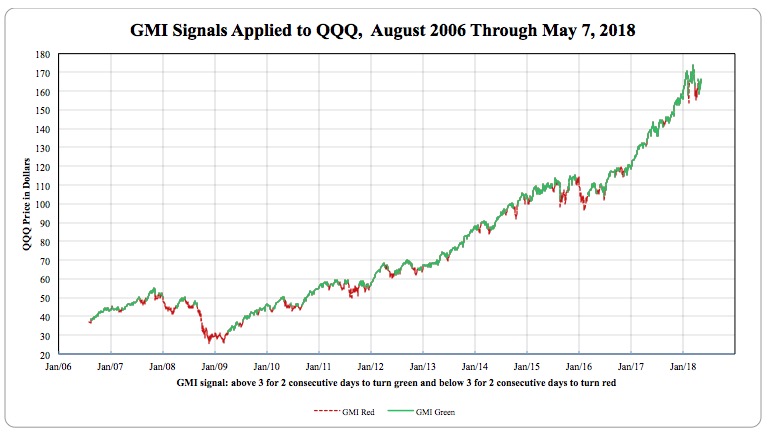
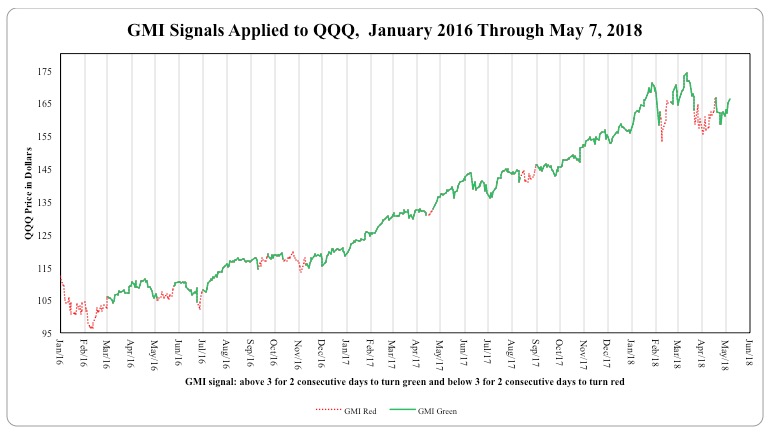
As you know, each weekend I post stats for my General Market Index (GMI), a collection of 6 indicators that help me to gauge the market’s trend. The GMI signal turns green after two consecutive days above 3. It then turns red after two consecutive days with readings less than 3. I am posting below two charts showing the QQQ during the periods when the GMI signal was red or green. I do not necessarily act quickly on a change in the signal, but the GMI does influence my trading greatly.
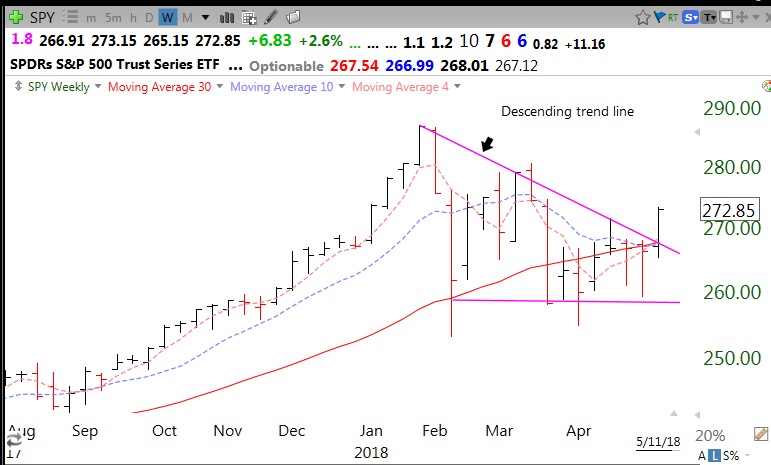
With the GMI signal turning Green, and the SPY breaking out of its descending trend line and above its 10 and 30 week averages, I started wading back into the market in my trading account and my university pension last week.
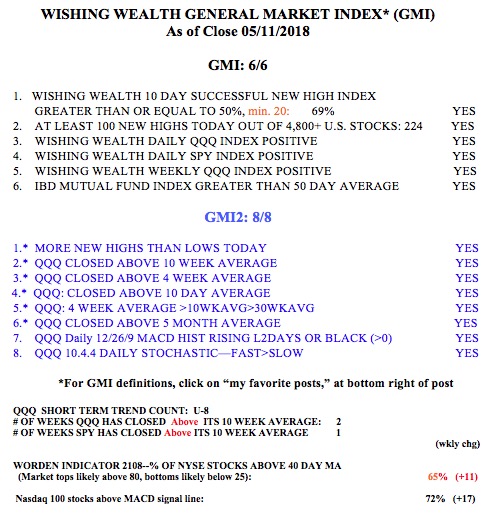
And here is the GMI table.


