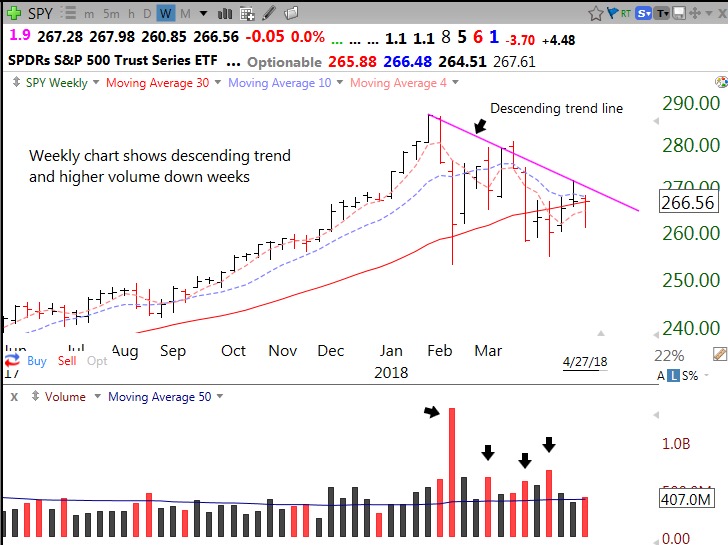
Below is a weekly chart of the SPY. It shows that the SPY closed above its rising 30 week average (solid red line) after having been well below it intraweek. Thus the Stage 2 up-trend remains intact. But there is a clear descending trend line. In addition, there are a lot of recent high volume down weeks, denoted by the arrows. This is institutional selling/distribution. Compare the pattern since late January with the pattern before, when it was comparatively easy to profit owning stocks. I am still out of the market, in cash, and waiting until earnings season is over to see if the market can hold its own. It could break either way……
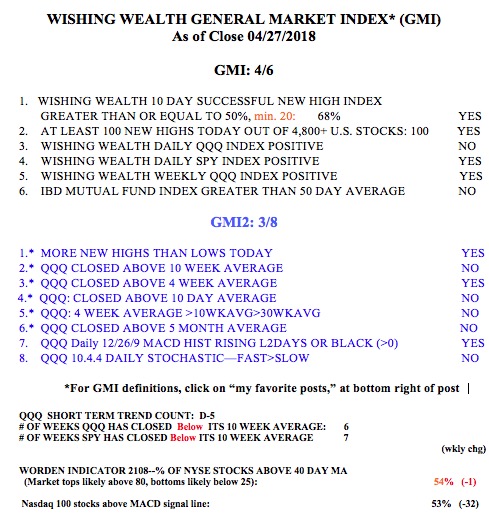
The GMI remains Green and at 4 (of 6). The more sensitive GMI2 is focused on the QQQ and is weaker, at 3 (of 8).


Thanks for posting your thoughts on the market.