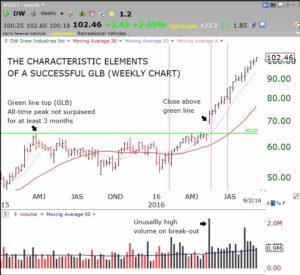
Last week I began a new semester with a class of 160+ freshmen who, I hope, want to learn technical analysis. I thought it would be helpful for them to see early on the type of rocket stock I want them to learn to identify. I look for green line break-out (GLB) stocks like DW, illustrated in the weekly chart below.
When I detect a stock that I am interested in, I first look at its monthly chart so I can draw a green line at it last all-time high price that has not been surpassed for at least three months. I am looking for a strong stock that has traded at its all-time peak price and that has now rested, or consolidated, usually for less than a year. I then wait for the stock to close above the green line I drew. I often set an alert in TC2000 that will let me know when a specific stock trades above the green line I drew. I next look to see if the break-out is occurring on a volume of trading that is higher than normal over the recent past.
This weekly chart of DW shows a close in mid-May above its green line top (near 65.25, its all-time high reached in late March) on the highest weekly trading volume in months. Note also that DW was climbing even when the QQQ (Nasdaq 100 index ETF) had experienced several declines. The amber vertical lines represent the end of market declines! Thus DW showed incredible strength relative to QQQ, another great sign of buying interest and indicating that it might be a promising rocket stock. Like most people, my students come into the class thinking they should buy cheap stocks at new lows and hope to sell them higher. (Buy sheep and sell deer!) The successful traders I have studied do the opposite. They buy new highs and sell them when they move higher. A successful rocket must be pointing up and climbing with great thrust.
One way I find promising stocks like DW is each weekend I use TC2000 to scan for all stocks that have closed at a new 52 week high on Friday and that traded a total number of shares that week that is at least 10% greater than its average weekly trading volume over the past few weeks and that traded at least 500,000 shares total for the week. This scan returned only 27 stocks out of more than 4900 stocks that I found also traded at an all-time high. Nine of these stocks closed above their last recent green line top (MELI, SHOP, CMN, MOMO, FOXF, INFO, ACGL, UNF, AOSL).
I am not suggesting that all GLB stocks work out. I will typically look at each company’s fundamentals and other relevant technical indicators to narrow down the list. After buying a GLB stock, I also must be vigilant and if the stock closes back below its green line or fails to climb consistently and rapidly like DW did, have planned exit strategies to sell out quickly and look for the next promising GLB stock. Every loss brings me closer to the next gain. To the right of this post is a link to a webinar I did in 2012 for TC2000 users. It provides more details about my trading methods. You also can sign up for my daily tweets and stock alerts: @wishingwealth. I often times tweet out a new GLB stock during the trading day.
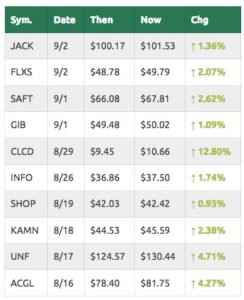
For those of you on this blog site, you know I post a GLB tracker table to the right. This table shows stocks that recently had a green line break-out (GLB) to an all-time high. It computes a daily record of how the stock performed since its break-out day. To update it this weekend, I ran a scan of all stocks that hit an all-time high on Friday and then drew in each green line top–a peak price not surpassed for 3 or more months. If one of these stocks had a GLB since August and met my scan criteria outlined above, and I judged it worthy of following, I listed it in the tracker table with the starting price equal to the green line top that it broke through and the date. So this is a biased selection of stocks that recently had a successful GLB and went on to reach an all-time high on Friday. By definition, all of these stocks are above their last green line tops. We will now be able to monitor how many of these stocks perform well from today on. Here is a screen shot of the new GLB tracker table. I currently own none of these stocks and this table is for educational purposes only.
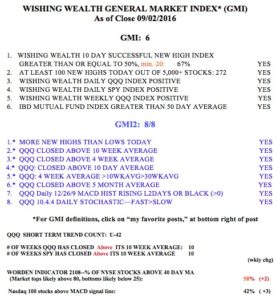
Below is this week’s GMI (General Market Index) table. My market indicators are all positive.


