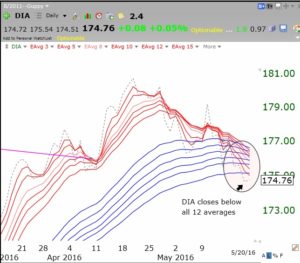
Friday was the 19th day of the QQQ short term down-trend, within a longer term down-trend. The Dow 30 stocks, measured by the ETF, DIA, is weaker than the QQQ. Note in this daily Guppy chart that the DIA is lower than all 12 daily moving averages. The dotted line is the weekly close of the DIA. The dotted line tends to lead the averages. The shorter term red averages are declining and if they create a BWR (blue/white/red) pattern the market will be in another swoon. Note the preceding RWB advancing pattern.
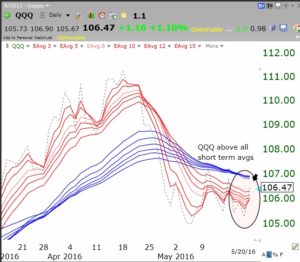
 The QQQ is showing a little more strength, but it remains in a BWR down-trend. . While it closed Friday below all of the blue (longer term) averages, the QQQ has climbed above all of its red (shorter term) averages. It has done this 2 times in the recent past and each attempt has failed to climb above the blue lines. A close of the QQQ above all of the blue lines (around 106.92) would be a strong show of strength and might signal the end of the BWR pattern. Stay tuned….
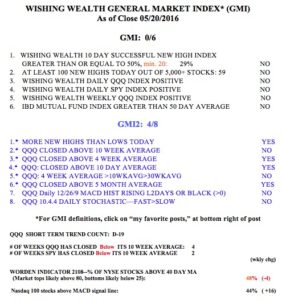
 Meanwhile the GMI remains at zero (of 6). I remain on the sidelines, mainly in cash…..
