I have started to tweet alerts that I get during the trading day. My tweets are designed to be educational and not trading recommendations. My tweets are also listed to the right of this post (@wishingwealth). I am showing you how I identify Green line Breakouts (GLB) during the trading day. I do not buy all GLBs that come up. If I do buy a GLB, I usually sell immediately if the stock looks like it will close back below the green line. I draw a green line at the highest all-time price a stock has traded at and not surpassed for at least three months. Basically it identifies a strong stock that has rested for at least 3 months and then breaks above its green line top. A list of some GLBs appears in the table to the right. GLBs tend to work best when the market is climbing higher. Now that the GMI is on a recent Buy signal, I am looking for GLBs to buy.
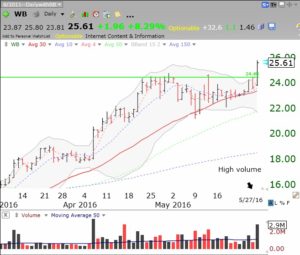
Below is a daily chart of WB, which I tweeted (and purchased) on Friday. I like the fact that it broke out on above average volume but will sell it mercilessly if it comes back below the green line. The first loss is the smallest loss…
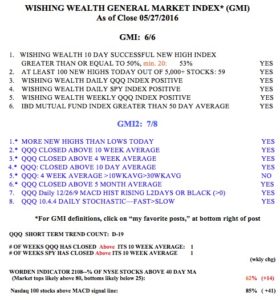
The GMI (general market index) remains at 6 (of 6).

