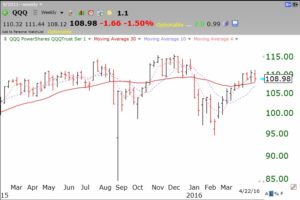
Last week the tech stocks under-performed and many high yielding “safe” stocks faltered. This weekly chart of QQQ (the NASDAQ 100 index ETF) shows that the index is resting on its 30 week average (red line). A close below this critical support would be very significant. With AAPL reporting earnings on Tuesday and FB on Wednesday, we will soon see if the QQQ can hold. The QQQ is basically at the same level it was about a year ago. The pattern here could be seen as a head and shoulders top. If the 30 week average turns back down, there could be a significant Stage IV decline.
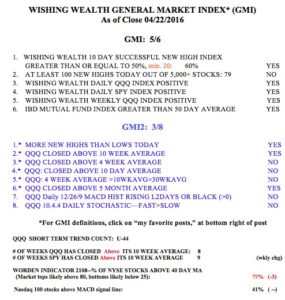
 While the GMI remains strong at 5 (of 6) the more sensitive and short term GMI2 is now at 3 (of 8).

The new format is fantastic. Please keep upp the good work. Thanks for all you do.
My thank you as well
This is an excellent format to go with your first class web blog. Thank you and congratulations on your launch.