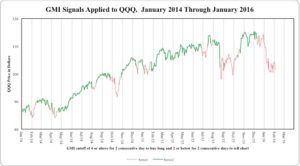
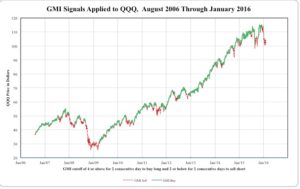
Here are my GMI signals applied to the QQQ the past two years and since inception. Click on charts to enlarge. (Past performance does not guarantee future performance!)

 The GMI issued its last signal, Sell, on December 10. (My QQQ short term trend count, currently at D-25, is based on a much more sensitive and short term count.)
Charts look ok but dates would clarify entry and exits. Also would like to go back to 2000. Want to include markets in 2000 and 2008…………..Thanks much…………..Rc……….
Hi Dr. Wish,
Thank you for this.
If I’m not mistaken, you often don’t react strictly according to the GMI, right? – but rather wait a few days for the trend to establish?
Dr Wish,
If you wouldn’t mind sending over your records of the GMI indicator, I’d be happy to do some analysis.
Thanks,
Rob
I started recording GMI in 2006.
Correct.
Need to be more specific.