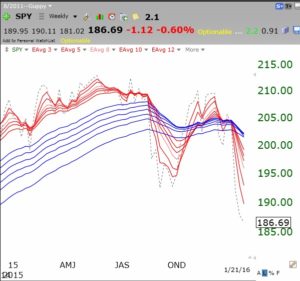
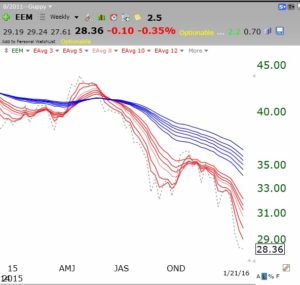
The weekly chart of the SPY shows all shorter term averages (red) declining below the longer term averages (blue) with a white space in between, hence BWR. This is a significant down-trend. The closing prices (dotted line) are leading all of the averages down.

