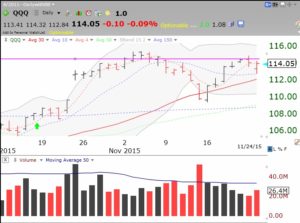
The QQQ is right at resistance, but it looks strong to me.
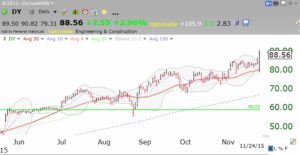
 After a GLB in May and a retest in June and August, DY continues up-trend. It has been number 1 in the IBD50 list and I own it.
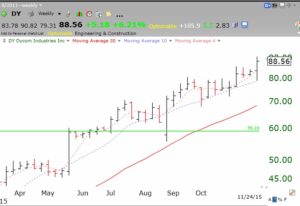
 Note how much clearer the trend is in a weekly chart.
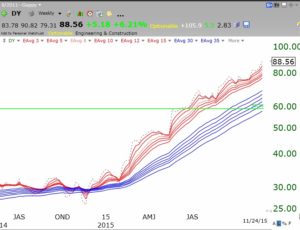
 And even clearer in a GMMA chart showing an RWB rocket pattern.
 I prefer an RWB pattern on my modified GMMA chart any day!
Happy Thanksgiving–I will post again on 12/2.
Hi Doc,
I’ve lost track. Are you in cash still?
Hello Dr. Wish,
I was wondering what your thoughts were on oil at this time. Technical Analysis seems to indicate that it has entered a stage 1 bottom. I begin buying about 4 months ago (right at the very bottom) when the news was completely full of bad news about oil and every headline seemed to read “oil heading to $20 per barrel”. I bought a large chunk at first because of the negative headlines and it was extremely oversold and have been modestly adding to it weekly. Now, I’m continuing to see negative headlines on oil but the market seems to be shrugging them off – which I presume means the smart money is heading into it.
What are your thoughts?
I was hoping you could lend some insight
Brendan: Oil is a sticky and dirty subject !!!