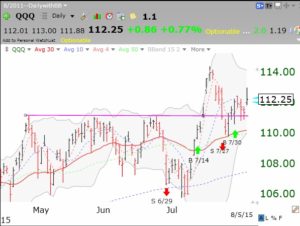
My GMI said to Buy on 7/30 and it was right! I wish I had had the courage to follow it earlier. I am adding long positions. Check out the daily chart of the QQQ. Note the GMI signals marked with red (sell) and green (buy) arrows.
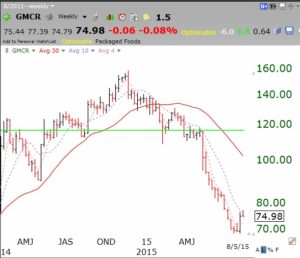
 None of my university students would have got stuck holding GMCR! As instructed by Stage Analysis, I never hold a stock trading below its declining 30 week average (solid red line). This weekly chart shows that GMCR first flashed a Stage IV sell signal in January.
