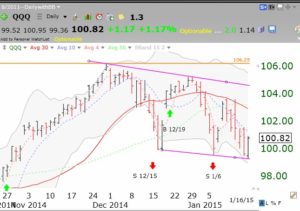
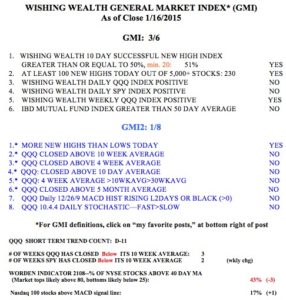
It is impossible to consistently predict what the market will do, except by luck. It is still possible, however, to use technical signposts to give one an edge for acting. This daily chart of QQQ shows some interesting things I monitor. First of all, the QQQ is below its 30 day average (red line) that is curving down. This is a very ominous short term sign. Second, note that the GMI has been on a Sell signal since January 6 and my short term daily trend indicator has now completed its 11th day (D-11, see GMI table below). Since 2006, 40% of these short term down-trends lasted between 11-44 days, 4% lasted 50+ days. The two solid magenta lines show the channel that the QQQ is currently within. Last Friday it bounced off of the lower channel line at which it has found support three times. It also found support near the lower daily 15.2 Bollinger Band (BB, see the bottom of gray area between the 2 bands). From all of the above, I think the QQQ is likely to rebound to the 30 day average, or to the top of the channel. If it should fail to hold Friday’s low, however, look out below………..
 The GMI, at 3 (of 6), remains on a Sell signal since January 6, but the GMI-2 (1/8) is showing considerable short term weakness.

Did you have time to update the number of stocks reaching new highs (item 2 of the GMI)? The table shows 230 which is identical to last week’s number. Using information from The Wall Street Journal, I thought the figure would have been higher.
Thanks in advance for your comments.
An observation and suggestion: Switch the position of line #3 and #4 in your GMI Market Index. Then the daily and weekly QQQ will sequence each other–right after the SPY.
Hi Dr. Wish
I always appreciate your frank honesty.
You point out “It is impossible to consistently predict what the market will do, except by luck”.
The “luck” part is a very honest statement!
Thanks for all you do.
Mike in Michigan