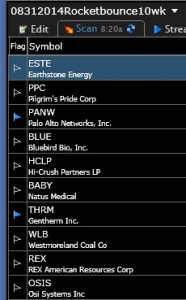
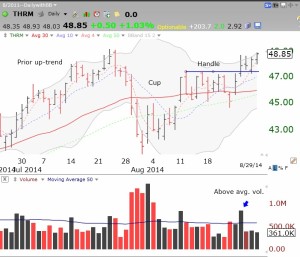
One of the best areas of support for a rising stock is its 10 week moving average. A lot of rocket stocks rest there and then resume their rise. I created a new TC2000 scan that scans over 6,000 U.S. stocks for a strong rocket pattern and a bounce up off of the stock’s ten week average. This scan gives me a small list of stocks to research further for possible purchase. This weekend’s scan yielded 10 stocks, shown on the right.  Two of them, PANW and THRM, have a blue flag on the left column, indicating they have appeared on an IBD50 list or other IBD lists at some point. I looked closely at THRM (which I own) and found that it appears to have broken out of a cup and handle pattern, a base that occurs in an up-trend. I have labeled this daily chart of THRM to illustrate the pattern’s primary components. First, there must be a prior up-trend because this is a continuation pattern. Second, there must be a pattern that looks like a side view of a cup and handle. Then there must be a break out above the top of the handle (blue solid line) on above average volume. IBD made this pattern famous as one that can lead to a large gain. As always, however, whether this break-out continues will depend on the general market’s trend. I typically sell quickly if a stock closes back below its 10 week average or if a break-out fails.
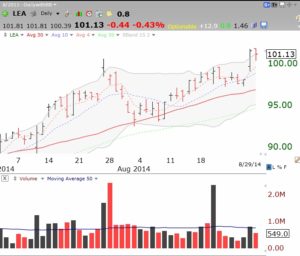
LEA is another cup and handle break-out in the strong auto parts group.
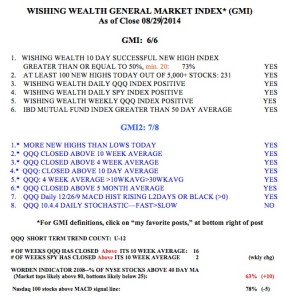
Meanwhile, the GMI remains at a strong 6 (of 6) and a Buy signal.


Dr. Wish: Is the Rocket Scan and Darvas scan described in your previous blogs? If yes, can you kindly give me the date of those blogs. Thanks
I have not recently described all of my scans. The Darvas scan is likely in one of my videos with a link on my site. Check out the Houston webinar.