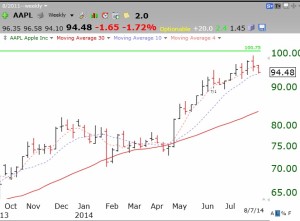
With the new short term down-trend reaching its 5th day on Thursday, I am slowly adding to my positions in the inverse 3X ETF’s SQQQ and SDOW. With the QQQ now below its 10 week average, my ability to make money trading on the long side is slim. This market looks like it wants to go down. AAPL is sitting on its 10 week average (blue dotted line) and a close below it would be a reason for me not to hold it. Click on chart to enlarge.

Dr. Wish, do you use TC2000 to determine if the QQQ closed above the 5 month average or some other method? Using TC2000, the answer for factor 6 of the GMI-2 would be YES and the GMI-2 would be 2 of 8. The issue with using TC2000 is that all the months are based on the calendar and the current month consists of only 5 trading days.
Thanks for sharing your insight.
Rick, you raise an important issue. I have been using TC2000.
Hi Dr Wish, I was wondering how to you track the 10 Day New Highs? Is it a matter of taking the New High list each day and comparing them manually in a spreadsheet or is there an easier way? Thanks so much.
I find AAPL is trading just above its 10 wk MA, the 30 wk MA is down about 83. Still not pretty.