A close of the QQQ below 94 would be a serious sign of weakness. QQQ closed Tuesday at 94.59. IBD has just labeled the “market in correction.” Maybe they heed the GMI signal??!! I am mainly in cash and short the market in my trading accounts.
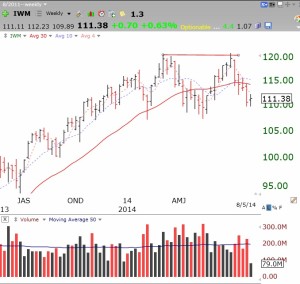
Note this ominous chart of small cap stocks reflected in the IWM ETF. There is a double top (horizontal red line), a decline below the critical 30 week average, and a lot of red spikes of high volume on down weeks. What is this chart telling us about the market?
