The truth is that no one knows for sure. IBD does still label the market in a correction. As I define it, the QQQ short term down-trend completed its 10th day on Friday. Another flat or up day on Monday will end the down-trend and begin a new QQQ short term up-trend. I am most certain of a change in trend when it persists for at least 5 days, however. I sold most of my SQQQ on Friday and will sell the rest on Monday if the QQQ holds. I will then buy a very small position in TQQQ and will only add to it at a higher price later in the week, probably on Friday. If a new short term up-trend begins and it is for real, then I will have many days on which to accumulate TQQQ. The key is to not rush in but to ease into the new move. On the other hand, if the QQQ weakens a lot on Monday, I will buy back some more SQQQ and ride the continuing down-trend. One must be agnostic in this business and ride whatever trend becomes apparent…..
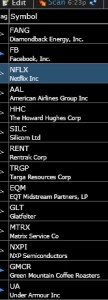
 As my readers know, I do not like to go long stocks in a general market down-trend. I find it to be very useful, however, to watch the new high list during declines because stocks appearing on it are exhibiting unusual strength. Any stock that can come through a correction and trade at a new high is demonstrating a lot of technical support. It is also much easier to find winners when there are only a handful of new highs. On Friday, only 14 stocks (out of 6,000) came up in my new 52 week high and good fundamentals TC2000 scan. All had recent quarterly earnings up at least 25% and increases in revenues. I think these stocks are worth researching for possible purchase in case a new up-trend begins. They appear to the left, sorted by recent EPS change, with the biggest earners at the top. Thus, the top six stocks each had quarterly earnings up more than 100%. Funny how stocks with big earnings increases appear on the new daily high list even during a market correction. It is noteworthy that all of these stocks are at or very close (GMCR) to trading at their all-time highs. Now that is a show of strength…….
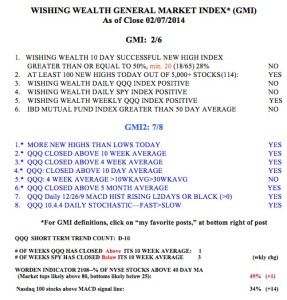
I prefer to buy strong stocks when the GMI is on a Buy signal. The GMI closed Friday at 2 (of 6) but the more sensitive and short term GMI-2 rose to 7 (of 8). The GMI flashed a Sell signal at the close of trading on 1/27 and remains so. I am therefore mainly in cash in my trading accounts but I do have a small position in SQQQ and GLD. My position in GLD is based solely on the technical pattern. It just looks like it is in a Stage 1 base. Note from this table that the QQQ has now closed back above its 10 week average, a very promising sign of strength. We will learn this week if the short term decline is likely over. Do not forget, however, that the QQQ remains in a longer term Stage 2 up-trend, as defined by Stan Weinstein.

When you “ease” into a position with TQQQ or SQQQ, approx what percentage of your trading account would you use for your first buy? Do you use stops? Are you at all concerned in buying one of these leveraged ETFs when the market is grinding sideways? Thanks so much.
Great article!
Thank you!
Can you share what your EasyScan looks like on TC2000 when you’re looking for new 52-week high with “good technicals”?
Send me an email request. It is basically new high with >25% eps and rev growth >0