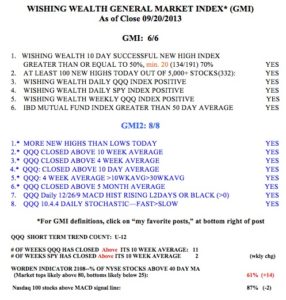
With all of my general market indicators positive, I must not fight this up-trend. The T2108 is at 61%, in neutral territory. I am hedging my long positions a little with some SPXS, in case the market has some fits over the current political fighting about funding the government and raising the debt ceiling….
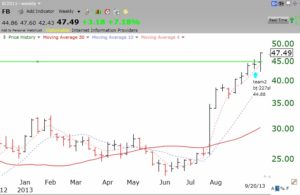
Meanwhile, FB had a nice green line break-out last week. I will hold FB as long as it holds the green line, around $45. See weekly chart below. (Ignore the annotations from my current class.) If you want to learn more about green line break-outs, view my free TC2000 Houston webinar from December, 2012, whose link is on the right of my blog page.
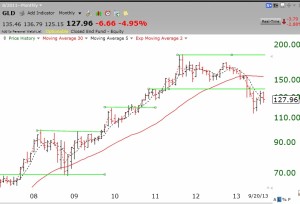
And this monthly chart of GLD shows the perils of hanging onto a stock in Stage 3 or 4 that has failed its green line break-out. I would be out of gold or short it. I only buy on the way up, above the top green line.
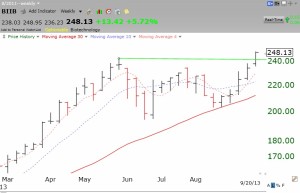
Finally, here is a weekly chart of BIIB, that had a green line break-out last week, one of about 50.
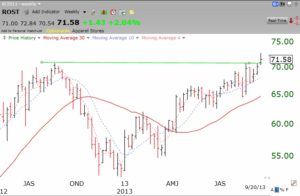
And one of ROST.
As to the GMI statistics:
