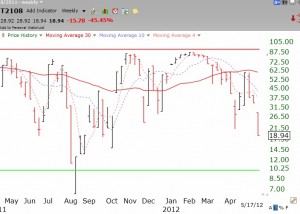
Once the Worden T2108 Indicator falls below 20% the market is getting very oversold. The last time T2108 was below 20% was last October. Some bottoms occur around this area, but if it breaks below 10% I will start to go long QLD, even with a GMI sell signal in place. The market just does not remain that oversold for long. I will then take a small position and only add to it at higher prices. I would only do this with an index ETF, not an individual stock. Individual stocks can go extinct, but not the entire market. Below is a weekly chart of the T2108 indicator.

The T2122 can also be useful.
Looks like the T2108 could be under ten by the end of the day if markets keep slipping. NASDAQ at lows for the day.
I appreciate your new video format. I find it beneficial to both see and hear simultaneously. However, I do miss your written word. To provide feedback about the effectiveness of this approach below, are my notes.
DR. WISH FIRST VIDEO BLOG THE MARKET TO BE IN OR TO BE OUT BUY SELL SIGNS 052112
HOW HE APPROACHES THE MARKET: TO BE IN OR TO BE OUT? THAT IS THE QUESTION!
MONTHLY CHART (Big long-term picture of the market)
SPY (large cap ETF): 5 mo MA, 30 mo MA
If 5 mo MA < 30 mo MA, SELL
During a big decline 5 mo MA 30 mo for a period of time or 5 mo < 30 mo. “How bad do things look overall!â€
5 mo MA < 30 mo MA is a STRONG SELL: A STOP SIGN; Get out of EVERYTHING. IT SAYS THE GENERAL BIG PICTURE IS BAD!
SELL IN MAY AND GO AWAY: Since 2000, you capture most of the gains except when there has been a very big decline just before May e.g., 2008-9. When you have had these immediate, prior large declines, the sign does not work (possibly due to reversion to the mean?).
WEEKLY CHART (provides an intermediate time frame picture)
SPY: 4, 10, 30 weekly MA
If SPY closes < 30 week average, DANGER SIGN, become concerned; get trading accts. Out of mkt.
STOCHASTICS 10, 4, 4 A way to determine: overbought/oversold
CROSSOVER: When the short-term Stochastic (crosses over)< long-term Stochastic, BAD SIGN
When the short-term Stochastic < long-term Stochastic, BAD SIGN
WORSE SIGN if the market had also been Oversold (<20)
Can stay above the 80, overbought line, for a long time. However they cannot stay below the 20 line, oversold, for long. So if STOCHASTICS < 20, expect a bounce. However don't re-enter the market on the bounce.
DAILY CHART (The short-term, immediate view) This covers the shortest time frame. So, it will react most quickly to market changes. However, there may be more false signals due to this brief time frame. So, consult the Weekly and Monthly views to put these findings in a longer-time frame/perspective.
SPY: 30, Day MA
If SPY closes < 30 day MA, SELL SIGN
Is 30 Day MA line bending down, SELL SIGN
STOCHASTICS 10, 4, 4
CROSSOVER: When the short-term Stochastic (crosses over)< long-term Stochastic, BAD SIGN
WORSE SIGN if the market had also been Oversold
Can stay above the 80, overbought line, for a long time. However they cannot stay below the 20 line, oversold, for long. So if STOCHASTICS 30 Day MA
BEST TIME TO SELL:
WHEN THE MARKET HAS BEEN OVERSOLD AND THE SHORT-TERM STOCHASTIC CROSSES OVER (ON THE WAY DOWN) THE LONG-TERM STOCHASTIC.