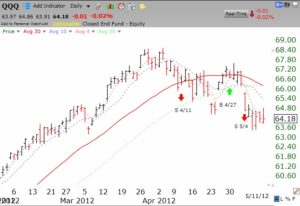
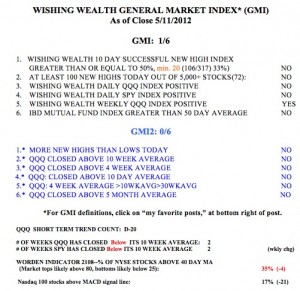
With the GMI at 1 and the GMI2 at 0 I am very reluctant to hold stocks. My trading accounts have been in cash for over a week. My university pension accounts remain invested in mutual funds, but I am considering raising some cash if we get a good bounce this week (see below). Too many sectors look weak, especially the commodities, suggesting to me a weakening worldwide economy. The down-trend in gold has also become stronger. As this daily chart of the QQQ shows, the 30 day average (red line) is now curving down and touching the 50 day average (green dots), and the shorter term, 4 and 10 day averages, are now declining below the important 30 day average. Compare the pattern of the past few weeks with that of the preceding time period. It does not take a skilled technician to see that the market is no longer in an up-trend. The AAPL chart is very similar to this one. The leaders are no longer charging ahead. This is no time to be brave……
Nevertheless, the QQQ daily 10.4 stochastic is at oversold levels (just below 20, not shown) and this usually portends some kind of short term bounce in the underlying Nasdaq 100 index, perhaps back to the 30 day average. (The T2108, at 35%, remains in neutral territory and suggests to me that the market is far from a real bottom.) If the QQQ rallies this week, I may take some of my university pension money off the table. We have been taught that we must always be invested and cannot time the market—rubbish!!! All successful speculators found that there was a time to exit the market or to be short. This, I believe, is one of those times. Once a market decline begins, no one knows, except by lucky guess, when and where it will end. Trend followers wait for signs of a turn before they act.
