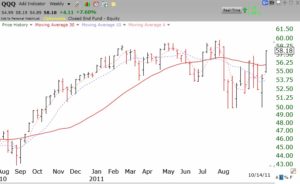
With the QQQ now back above its 30 week average (solid red line), I am ready to reenter this market. The QQQ, composed of tech stocks, is outperforming the SPY and DIA.
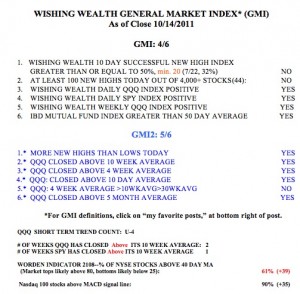
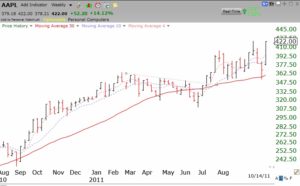
Friday was the 4th day of the new QQQ short term up-trend. AAPL has emerged as a leader again and there is too much bearish market sentiment.
The GMI is now back to 4, reflecting the growing strength in the market indexes.
Check out this weekly chart of AAPL. It is back above its 10 week average (blue dotted line). Click on chart to enlarge.


From following your posts for a while now, it seems to me that your GMI and GMI-2 have not worked very well over the recent months.
For example, you have a short term downtrend starting on precisely the day that the market bottomed. Now after a 14% run, they are saying to get back in. Someone following these indicators would have lost significantly.
Market breadth indicators on the other hand clearly pointed to Oct3/4 as lopsided negative breadth, indicating likely market bottom. And then the lopsided reversal breadth over the next couple of days confirmed this.
I like following moving averages also, but they need to be looked at with some additional context and breadth indicators.
Hi Brian – you are correct. However, the recent volatility and trading range will play havoc with everyone’s favored indicators. Like anything that works in trading, results need to be viewed in a longer term time frame. I think Wish’s GMI’s do a pretty decent job. Besides risk management is paramount and trumps all indicators. Acceptable stops would only have a trader losing a fraction of that 14% while waiting for the next signal.