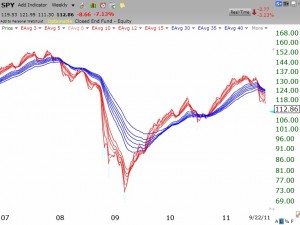
Thursday was the 11th day of the QQQ short term up-trend. A down of flat day wil change my trend count to negative. Time to be defensive. The Worden T2108 indicator is at 19%. It got to 7% at the bottom on August 8. Anytime T2108 gets into single digits it has been a good time to buy a bullish index ETF like SPY, DIA or QQQ. However, right now it looks like a continuing Stage 4 decline (see weekly GMMA chart of SPY below). My university pension is 70% in cash.

BIDU might be a stage four in a few weeks. Shorting stock at 118. Not a very good sign for the Chinese Markets.
BIDU 10 wk avg still above 30 wk. Too early for me to short.Also, too soon after peak. I would at least wait for a bounce down off of the 30 day avg.
Dr Wish, what web site can I go to look at your SPY graph (red/blue) on a daily basis? thanks
DrWish, what web site can I go to look at your SPY graph (red/blue) on a daily basis? thanks
You would have to build your own GMMA chart, which is a chart with 12 exponential moving averages. You could do it using freestockcharts.com.