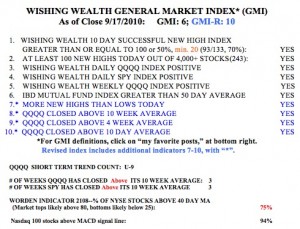
With options expiration behind us, the next major event that may cause the stronger growth stocks to go higher is the end of quarter mutual fund window dressing. This event will be followed by release of quarterly earnings beginning in mid-October, followed by election results. All of these events might give the market a reason to rise, but we may have the typical October swoon somewhere in here. But with the GMI at 6 (of 6), I remain long in my IRA and 100% invested in my university pension.  The QQQQ short term up-trend has now completed 9 days (U-9) and the QQQQ and SPY have now closed above their 10 week averages for three weeks. The Worden T2108 indicator is at 75%, which is high but not at an extreme over-bought level yet. 94% of the Nasdaq 100 stocks closed with their MACD above its signal line, a sign of short term strength. While the media pundits appear to be focusing on the idea that the S&P500 index is at the top of its recent trading range, it appears to me that tech stocks, as measured by the QQQQ have already broken out of their range. Tech stocks may lead the market higher, with so many new developments exciting people, such a cloud computing (CTXS, FFIV) and electric cars (PPO, SQM). And the fact that such market leaders as PCLN, NFLX, CMG and AAPL continue to rise, bodes well for the market.
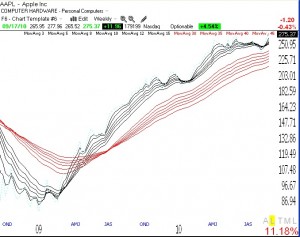
A major characteristic of rocket stocks in strong up-trends is that their short term averages are well above their rising longer term averages. I think that the weekly GMMA provides an extraordinary way for identifying such stocks. AAPL provides a great example, below. Note that this weekly chart (click on to enlarge) has all of the shorter term averages (black) well above their rising longer term averages (red). AAPL has consolidated the past 5 months but appears to be getting ready to break to all-time highs. I own some AAPL, and if it breaks out, we could see a strong move up. This weekly GMMA chart shows the typical chart pattern of all rocket stocks that I buy.
