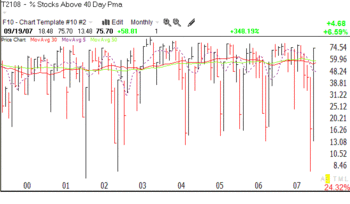
The General Market Index (GMI) remains at the maximum reading of 6.  Interestingly, the Worden T2108 indicator (% of NYSE stocks above their 40 day average– click on monthly chart to enlarge) has rebounded from a low in August around 7% to a current reading of 76%. Market tops occur around 80%, but the market can stay in this high area for months. The T2108 indicator represents to me the pendulum of the market and comes with the Worden TC2007 stock charting program that I use every day. Most recent market bottoms came when this indicator was below 20%. In the October 1987 debacle, it fell to under 1%!
I am eagerly awaiting option expiration this Friday, when most of my stocks will be called away and I can write new October covered calls on IBD100 stocks that are in steady up-trends. I will also retain my long position in QLD as long as the GMI remains strong…
See my disclaimers below.