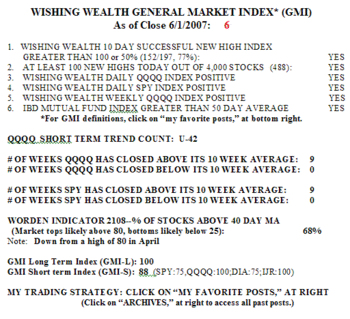
The GMI remains at the maximum level of 6.  There were 488 new 52 week highs in my universe of 4,000 stocks on Friday, the most since December 5. This is a very strong up-trend with many stocks moving up. Friday was the 42nd day in the current QQQQ up-trend. Why is the market so strong? I searched for any technical indicator that might provide a clue to the rise. And then I found it in an indicator I haven’t looked at for quite a while.
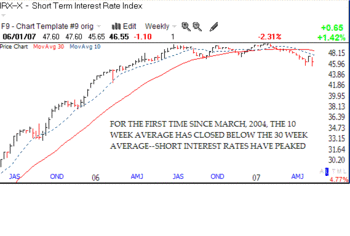
Take a look at this chart of the short term interest rate indicator. Note that the 10 week moving average (dotted blue line) has curved down and is now below the 30 week average (solid red line), which appears to have peaked.  The last time that the 10 week was below the 30 week was in March, 2004, before the Fed started to raise rates. It now looks like the next move by the Fed will be to lower rates. It may already have begun. Could that be why this market is rising?
See my caveats at the bottom of my prior post.
Actually, if you take a look at the monthly graph you’ll see a giant cup-with-handle ready to break out. Let’s hope that that doesn’t happen or else we’ll be screwed. haha.