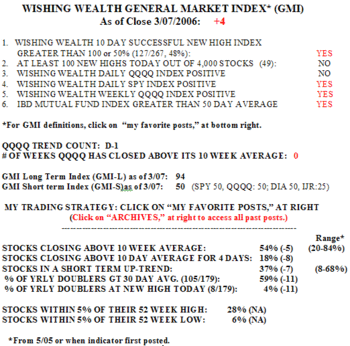
The GMI fell to +4 as my market indicators seriously weakened. There were 49 yearly highs and 65 new lows in my universe of 4,000 stocks on Tuesday. When more stocks hit new lows than highs, it is often a very ominous sign for the market.  Less than one half of the stocks that hit a new high 10 days ago closed higher on Tuesday than they did 10 days earlier. Only 4% of the stocks that doubled in the past year hit a new high on Tuesday. Only 37% of stocks remain in a short term up trend, and only 18% are in a sustained rise. Only 54% of stocks closed above their 10 week averages. The GMI-S fell to 50, with the IJR index(small cap) indicators showing the largest weakness. Only one of the four short term indicators of the IJR remain positive. Only one half of the indicators for the SPY, DIA and QQQQ remain positive. Tuesday was day one (D-1) of the new QQQQ down trend. The continued weakness in the two market leaders (GOOG and AAPL) has been a good predictor of market weakness. I am becoming defensive and raising cash and/or going short, focusing on the housing and interest rate related stocks….
Please send your comments to: silentknight@wishingwealthblog.com.