To my visitors: I am only one trader, not a guru, and not a financial advisor. I am presenting my own opinions and my own experiences and people are welcome to decide for themselves what, if anything, on this site is of value to them. Please refer to the additional comments, highlighted in red, at the end of this post.
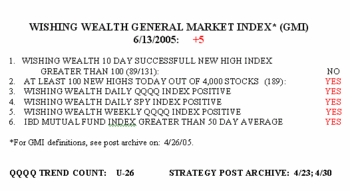
The GMI bounced back today to +5 with the QQQQ weekly index turning positive again. There were 189 new 52 week highs in my universe of 4,000 stocks and only 24 new lows. All three market indexes were in harmony with 60-67% of the stocks in the Nasdaq 100, the S&P 500 and the Dow 30 rising today. Today is day 26 in the up trend (U-26).
I thought it might be informative to show you how the GMI has performed since I began posting it in April (click on graph to enlarge).  During the last part of April, as the QQQQ was bottoming, the GMI was steady at zero. On May 4, the GMI turned 1 and varied between 1 and 3 over the next few days as the QQQQ strengthened. Since May 18, the GMI has consistently registered 3 or above. …………………………..
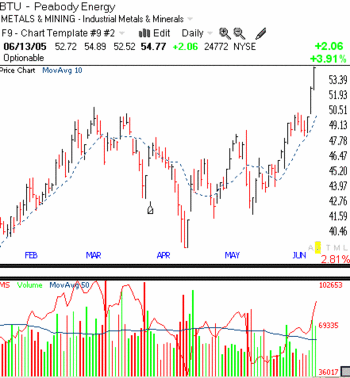
I bought some BTU today. It came up in a market scan I did over the weekend that focused on stocks hitting new highs that day.  On Friday, BTU gapped up and closed at a new high of 52.71. I placed a stop order Sunday night to buy the stock if it traded above Friday’s intraday high price of 52.91. After the buy stop was executed around 53.10 on Monday, I placed a sell stop in just below Friday’s low around 49.90. I reasoned that if the stock was weak enough to close Friday’s gap, I wanted to be sold out. BTU closed at 54.77 today up $2.06.
Why did I buy BTU? The metals and mining industry is strong and has had a number of stocks hitting highs. The stock had formed a long base since topping out in March. The stock seems to follow its 10 day average (dotted line). Look at how the stock consistently remained above its 10 day average last February and March during its big rise, and recently. The rise on Friday occurred in above average volume (above the horizontal blue line indicating the 50 day moving average of volume). The MoneyStream line (red line) was rising strongly. The IBD check up gave BTU a grade of "A." And my TC2005 program showed the annual earnings up 162% with a PE of only 34. Yahoo finance shows that earnings estimates over the next few quarters are for triple digit increases. So, putting this all together I was willing to place a bet, limit my potential loss and take my chances. Of course, the only reason I am willing to make purchases is the fact that the GMI indicates a market in a confirmed up trend.
Send your feedback to silentknight@wishingwealthblog.com.
Please remember that the stock market is a risky place, especially now. I am not providing recommendations for you to follow. My goal is to share tools and methods that I have used over the past 40 years of trading, so that you may learn from them and adapt them to your trading style and needs. While I do my best, I do not guarantee the accuracy of any statistics computed or any resources linked to my blog. Please consult with your financial adviser and a mental health practitioner before you enter the stock market, and please do not take unaffordable risks in the current market environment. See the About section for more statements designed to protect you (and me) as you navigate this market. Past performance does not guarantee future results, but I would rather learn from a former winner than a loser.